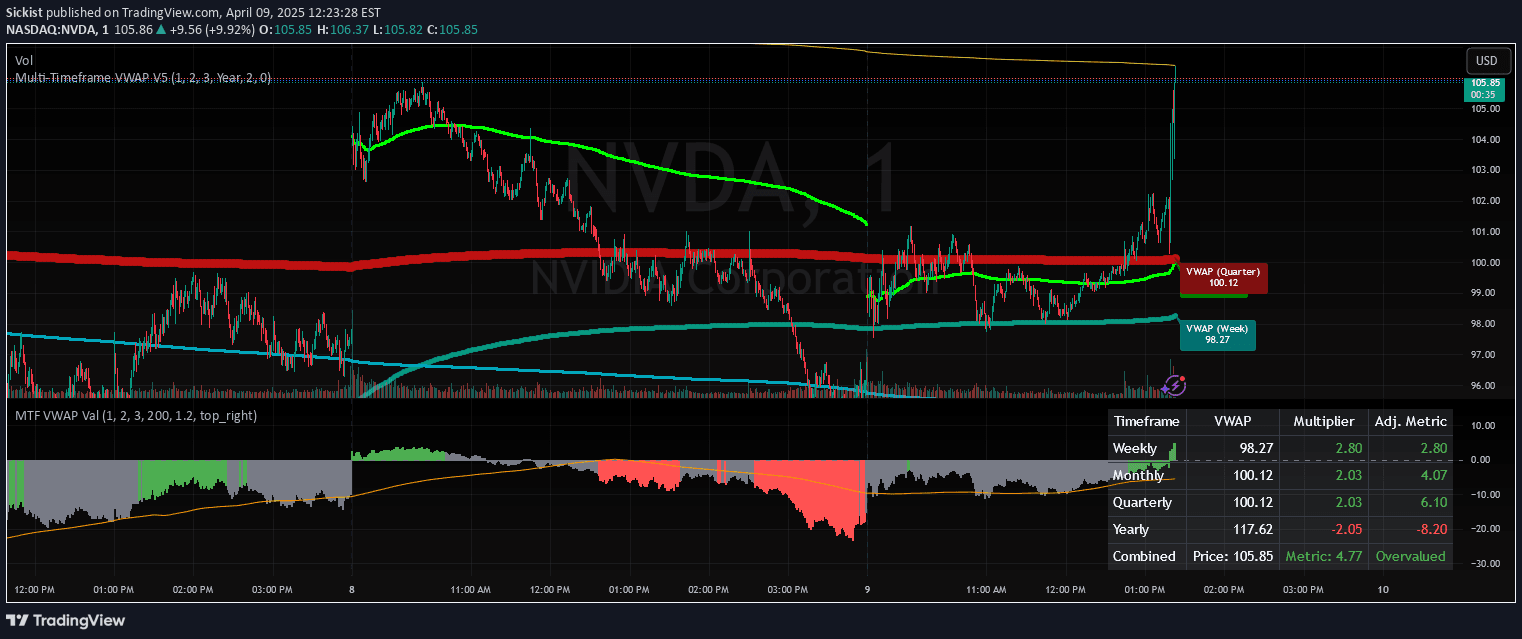
A monthly performance tracking tool that provides a comprehensive overview of percentage gains and losses across customizable timeframes, helping traders analyze historical performance trends.
Explore complementary indicator rolesHow it works
The 1A Monthly P&L Table calculates the percentage change between monthly closing prices, creating a systematic performance record. It starts by determining the percentage difference from the previous month's close to the current month's close, ensuring a precise measurement of financial movement.
For the initial month displayed, the indicator computes performance from the chart's first bar's opening price to the month's close. The table updates on the last bar of each trading day, providing traders with an automatically refreshed view of their monthly financial progression and helping them track their strategy's effectiveness.
Why it may be useful
Monthly performance tracking provides traders with critical insights into their strategy's consistency and long-term potential. By visualizing percentage gains and losses across different months, traders can identify patterns, seasonal trends, and potential areas of improvement in their trading approach.
The tool's ability to generate a cumulative P&L allows traders to understand their overall performance trajectory. This comprehensive view helps in making informed decisions about strategy refinement, risk management, and potential adjustments to trading methodologies based on historical performance data.
When to explore it
The 1A Monthly P&L Table is most effective for traders seeking a clear, concise overview of their trading performance across different timeframes. It is particularly useful for those who want to analyze their strategy's performance on daily and intraday charts, providing a granular view of monthly financial movements.
Traders can leverage this tool during strategy development, performance review, and risk assessment phases. By customizing the display to show between 1 and 60 months, users can adapt the table to their specific analytical needs, making it a versatile instrument for understanding trading performance trends.
Keep exploring
What we’ve verified
Access, alerts and repainting behaviour have not been independently verified for this indicator. Check the creator’s current publication and settings.
General descriptions and classifications are recovered research. Verified details above identify the specific checks we have completed. Check the creator’s current publication for later changes.