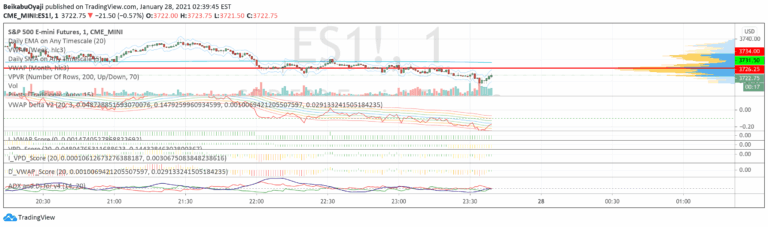
ADX and DI
ADX measures trend strength and direction by analyzing price movement. It helps traders identify the presence and power of a trend, indicating whether a market is trending or ranging.
Explore 11,183 indicators. Filter beyond the obvious.
Discover the tools that fit the way you trade.
11,183 tools to explore
ADX measures trend strength and direction by analyzing price movement. It helps traders identify the presence and power of a trend, indicating whether a market is trending or ranging.
A market structure break and order block indicator that identifies trend reversals by analyzing price action breakouts and key candle formations to signal potential trading opportunities.
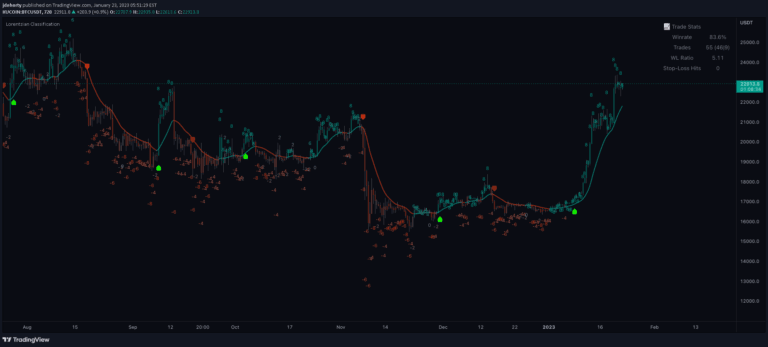
A machine learning trading signal using Lorentzian Distance Classifier to predict price movements by analyzing historical data patterns and identifying nearest neighbors in a multi-dimensional feature space.
Advanced trading tool that detects divergences across multiple technical indicators, helping traders identify potential trend reversals and momentum shifts through comprehensive pivot point analysis.
A customizable trading indicator designed to identify ICT Killzones and track high and low price pivots during specific market sessions with configurable time windows.
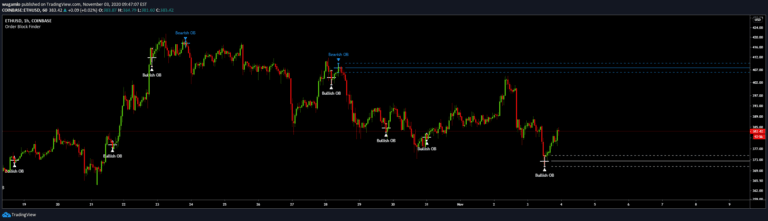
An indicator identifying institutional order blocks by detecting significant price zones where potential trend reversals or continuations might occur based on sequential candle patterns.
Pivot Point SuperTrend is an advanced trend-following indicator that combines pivot points with SuperTrend to generate more reliable trading signals and identify potential trend reversals.
A machine learning-powered SuperTrend indicator that uses k-means clustering to dynamically adapt to market volatility, providing intelligent trend identification and volatility insights.
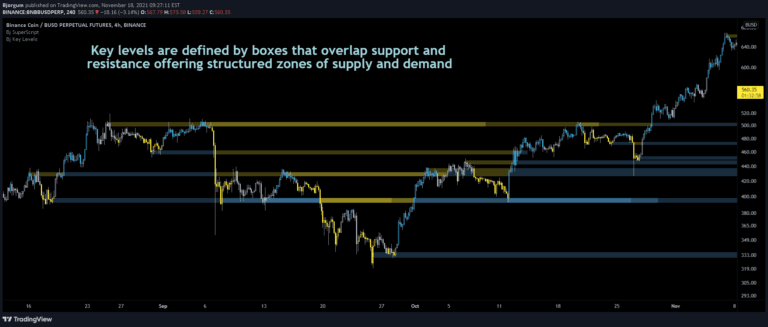
Key Levels strategy identifies critical price action points like breakouts, false breakouts, and backchecks to help traders understand market movement and potential trading opportunities.
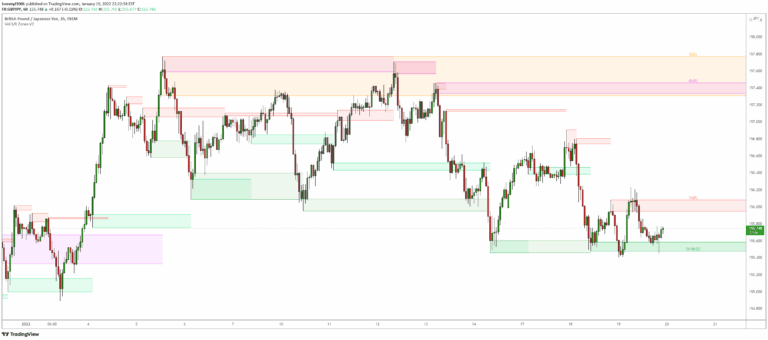
An advanced Support & Resistance indicator that identifies significant price zones using volume and fractal highs/lows, helping traders visualize potential trend reversals and continuations.
A liquidity indicator that highlights swing areas with trading activity, tracking price revisits, accumulated volume, and potential support/resistance zones using customizable filtering.
SuperTrend AI is an advanced machine learning technique that applies K-means clustering to the SuperTrend indicator, dynamically adapting trailing stop settings based on performance metrics.
Likes, views, and comments are historical TradingView snapshots. They describe attention, not trading performance.
A quick guide to finding your next indicator and knowing what to check.
Start with the question you want an indicator to answer: trend, momentum, volume, volatility or price levels. Search by name, creator or concept, then narrow the catalog by category, trading style and chart placement.
Read the description and verification notes before opening the creator’s TradingView page. Popularity can help you discover tools; it does not show whether a tool will work for your market or settings.
Explore the indicator libraryYes. Use Most liked, Most viewed or Most discussed to sort the catalog. Open More filters to set minimum counts, search for a creator or exclude terms.
These counts are recovered historical snapshots, not live TradingView totals. If the capture date is unknown, we say so. Each indicator links to TradingView so you can check its current publication.
Browse by historical viewsAsk in everyday language, such as “What is the most popular volume indicator?” or “What could complement VWAP?” DeepAlpha uses catalog descriptions to explain relevant tools and links directly to their detail pages and TradingView publications.
Treat the answer as a research starting point. Check the script’s current features, settings and access with its creator.
Ask your own questionOpen an indicator’s “What we’ve verified” section. It separates facts checked against a source, claims made by the creator, and information that has not been verified. Reviews include a date, source and scope.
A source check is not a live replay test or a promise that signals never change. Read the timing notes, especially for open candles, higher timeframes and markers drawn on earlier bars. Check the creator’s current publication for access and alert instructions.
Read our review methodologyUse the TradingView link on its DeepAlpha detail page to open the original publication. Follow the author’s instructions, then find the script in TradingView’s Indicators menu or your favourites.
DeepAlpha does not grant access to protected or invite-only scripts. Any permission, payment or account requirements are set by the creator and TradingView.
Read the step-by-step guideYes. Select Compare on two to four indicators and open the comparison. Review their purpose, chart placement, trading styles, historical popularity and available verification notes side by side.
On a phone, swipe the comparison table horizontally to see the other columns. You can share its URL; your private notes and collections are not included.
Start a comparisonChoose tools that answer different questions. Our guided combinations explain roles such as trend strength, momentum and volatility, with a suggested research workflow and notes on overlapping inputs.
Two indicators agreeing is not automatically independent confirmation. The combinations are educational frameworks, not backtested strategies or trading signals.
Explore guided combinationsSign in with a one-time email code, create a collection and save the indicators you want to revisit. Add private notes about settings, questions or observations, then return to them in My Library on another device.
Your collections and notes belong to your account. Browsing, Ask DeepAlpha and comparisons remain available without signing in.
Open My LibrarySave a filtered search or follow a creator to receive in-site updates when matching records are added or changed in DeepAlpha after you start following. Manage, rename or pause them in My Updates.
This tracks changes in our catalog, not live TradingView activity. Existing records do not create new alerts just because you save a search. No notification emails are sent.
Manage saved searches and updatesNot yet. DeepAlpha helps you discover, understand and compare indicators. Likes, views and comments measure historical attention, not returns, accuracy or a win rate.
An indicator needs explicit entry and exit rules, suitable data and realistic trading costs before it can be evaluated as a strategy. Our current catalog and guided combinations do not provide that performance test.
Learn how to compare indicators fairly