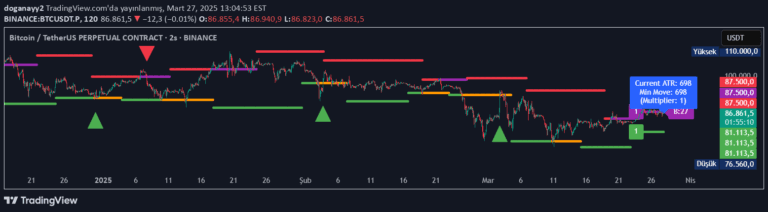
A machine learning-powered SuperTrend indicator that uses k-means clustering to dynamically adapt to market volatility, providing intelligent trend identification and volatility insights.
Explore complementary indicator rolesHow it works
The Machine Learning Adaptive SuperTrend begins by calculating Average True Range (ATR) values over a specified training period to assess market volatility. It uses k-means clustering to categorize these ATR values into three distinct volatility clusters: high, medium, and low, with the algorithm iteratively optimizing the centroids of these clusters.
Once the volatility is classified, the indicator dynamically adjusts the SuperTrend calculation based on the current market condition. By applying the classified volatility level to the traditional SuperTrend method, it creates a more responsive and adaptive trend identification tool that can quickly recognize and signal potential trend shifts across different market environments.
Why it may be useful
Traditional trend indicators often fail to adapt to changing market conditions, providing lagging or inaccurate signals during volatile periods. The Machine Learning Adaptive SuperTrend addresses this limitation by incorporating advanced machine learning techniques that dynamically classify market volatility, offering traders a more nuanced and responsive trend detection mechanism.
By leveraging k-means clustering, the indicator provides traders with a sophisticated tool that can distinguish between different volatility regimes, helping them make more informed trading decisions. This approach allows traders to better understand market dynamics, potentially reducing false signals and improving overall trading strategy effectiveness.
When to explore it
The Machine Learning Adaptive SuperTrend is most effective in markets with significant volatility variations, such as cryptocurrency, forex, and certain stock indices. It performs exceptionally well during periods of market transition, where traditional trend indicators might struggle to provide clear signals.
Traders should consider using this indicator when they want a more intelligent and adaptive approach to trend identification. It is particularly useful for traders who want to capture trend shifts quickly, manage risk more effectively, and gain deeper insights into market volatility across different timeframes and market conditions.
Keep exploring
What we’ve verified
Access, alerts and repainting behaviour have not been independently verified for this indicator. Check the creator’s current publication and settings.
General descriptions and classifications are recovered research. Verified details above identify the specific checks we have completed. Check the creator’s current publication for later changes.