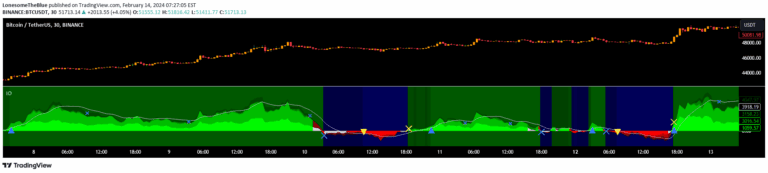
Divergence for Many Indicators v4
Advanced trading tool that detects divergences across multiple technical indicators, helping traders identify potential trend reversals and momentum shifts through comprehensive pivot point analysis.
Explore 11,183 indicators. Filter beyond the obvious.
Discover the tools that fit the way you trade.
11,183 tools to explore
Advanced trading tool that detects divergences across multiple technical indicators, helping traders identify potential trend reversals and momentum shifts through comprehensive pivot point analysis.
Pivot Point SuperTrend is an advanced trend-following indicator that combines pivot points with SuperTrend to generate more reliable trading signals and identify potential trend reversals.
A machine learning-powered SuperTrend indicator that uses k-means clustering to dynamically adapt to market volatility, providing intelligent trend identification and volatility insights.
The Adaptive Trend Finder is an advanced trading indicator that autonomously detects trend channels using logarithmic scale regression, offering flexibility in long-term or short-term trend analysis.
The Ultimate RSI is an advanced oscillator that enhances traditional RSI by emphasizing trend dynamics, providing more precise insights into market momentum and directional movements.
AlphaTrend is a dynamic trend-following indicator that uses Money Flow Index or RSI to generate buy and sell signals based on trend direction and momentum crossovers.
Zero Lag Trend Signals is an advanced indicator that eliminates trend detection delays by using zero-lag EMA and volatility bands across multiple timeframes.
Ichimoku Oscillator is a multi-layered technical analysis tool that evaluates market trends using Ichimoku Cloud features, providing insights into potential entry and exit points.
A dynamic trading panel displaying multiple technical indicators in a color-coded table format, allowing traders to quickly assess market conditions across multiple symbols simultaneously.
A sophisticated trading signal that combines trend detection, price rejection logic, and dynamic ATR-based target projection to identify and validate potential trend continuation opportunities.
Kalman Trend Levels is an advanced indicator that identifies trend shifts, support/resistance zones, and momentum changes using dynamic Kalman filter crossovers and adaptive visualization techniques.
A dynamic trend analysis tool using Hull-EMA curves that color-codes price bars, plots support/resistance boxes, and identifies high-probability breakout retests for traders.
Likes, views, and comments are historical TradingView snapshots. They describe attention, not trading performance.