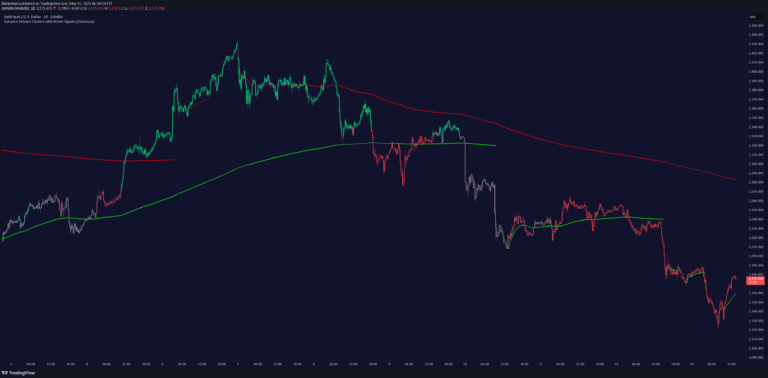
Kalman Trend Levels is an advanced indicator that identifies trend shifts, support/resistance zones, and momentum changes using dynamic Kalman filter crossovers and adaptive visualization techniques.
Explore complementary indicator rolesHow it works
The Kalman Trend Levels indicator operates by utilizing two Kalman filters - a fast and a slow line - that dynamically track price movements and trend directions. When these lines cross, they generate specific signals and visual markers, such as green or red boxes representing support and resistance zones.
The indicator uses adaptive candle coloring to reflect trend momentum, changing colors when the trend's strength weakens. Crossover points are marked with arrows and price labels, providing traders with precise visual cues about significant trend changes and potential entry or exit points.
Why it may be useful
The Kalman Trend Levels indicator is crucial for traders seeking to understand market dynamics with greater precision and clarity. By providing dynamic trend analysis, it helps traders identify subtle shifts in market momentum that might be missed by traditional indicators.
Its unique visualization techniques, including adaptive candle coloring and crossover signals, enable traders to quickly interpret market conditions, recognize potential trend reversals, and make more informed trading decisions across various market conditions and timeframes.
When to explore it
The Kalman Trend Levels indicator is most effective in trending markets where clear directional movements are present. It works exceptionally well in markets with moderate to high volatility, where trend identification and momentum shifts are critical for successful trading strategies.
Traders can leverage this tool across multiple timeframes, from scalping to swing trading, making it versatile for different trading styles. It is particularly useful when seeking to confirm trend changes, identify potential support and resistance levels, and capture re-entry points during market transitions.
Keep exploring
What we’ve verified
Access, alerts and repainting behaviour have not been independently verified for this indicator. Check the creator’s current publication and settings.
General descriptions and classifications are recovered research. Verified details above identify the specific checks we have completed. Check the creator’s current publication for later changes.