
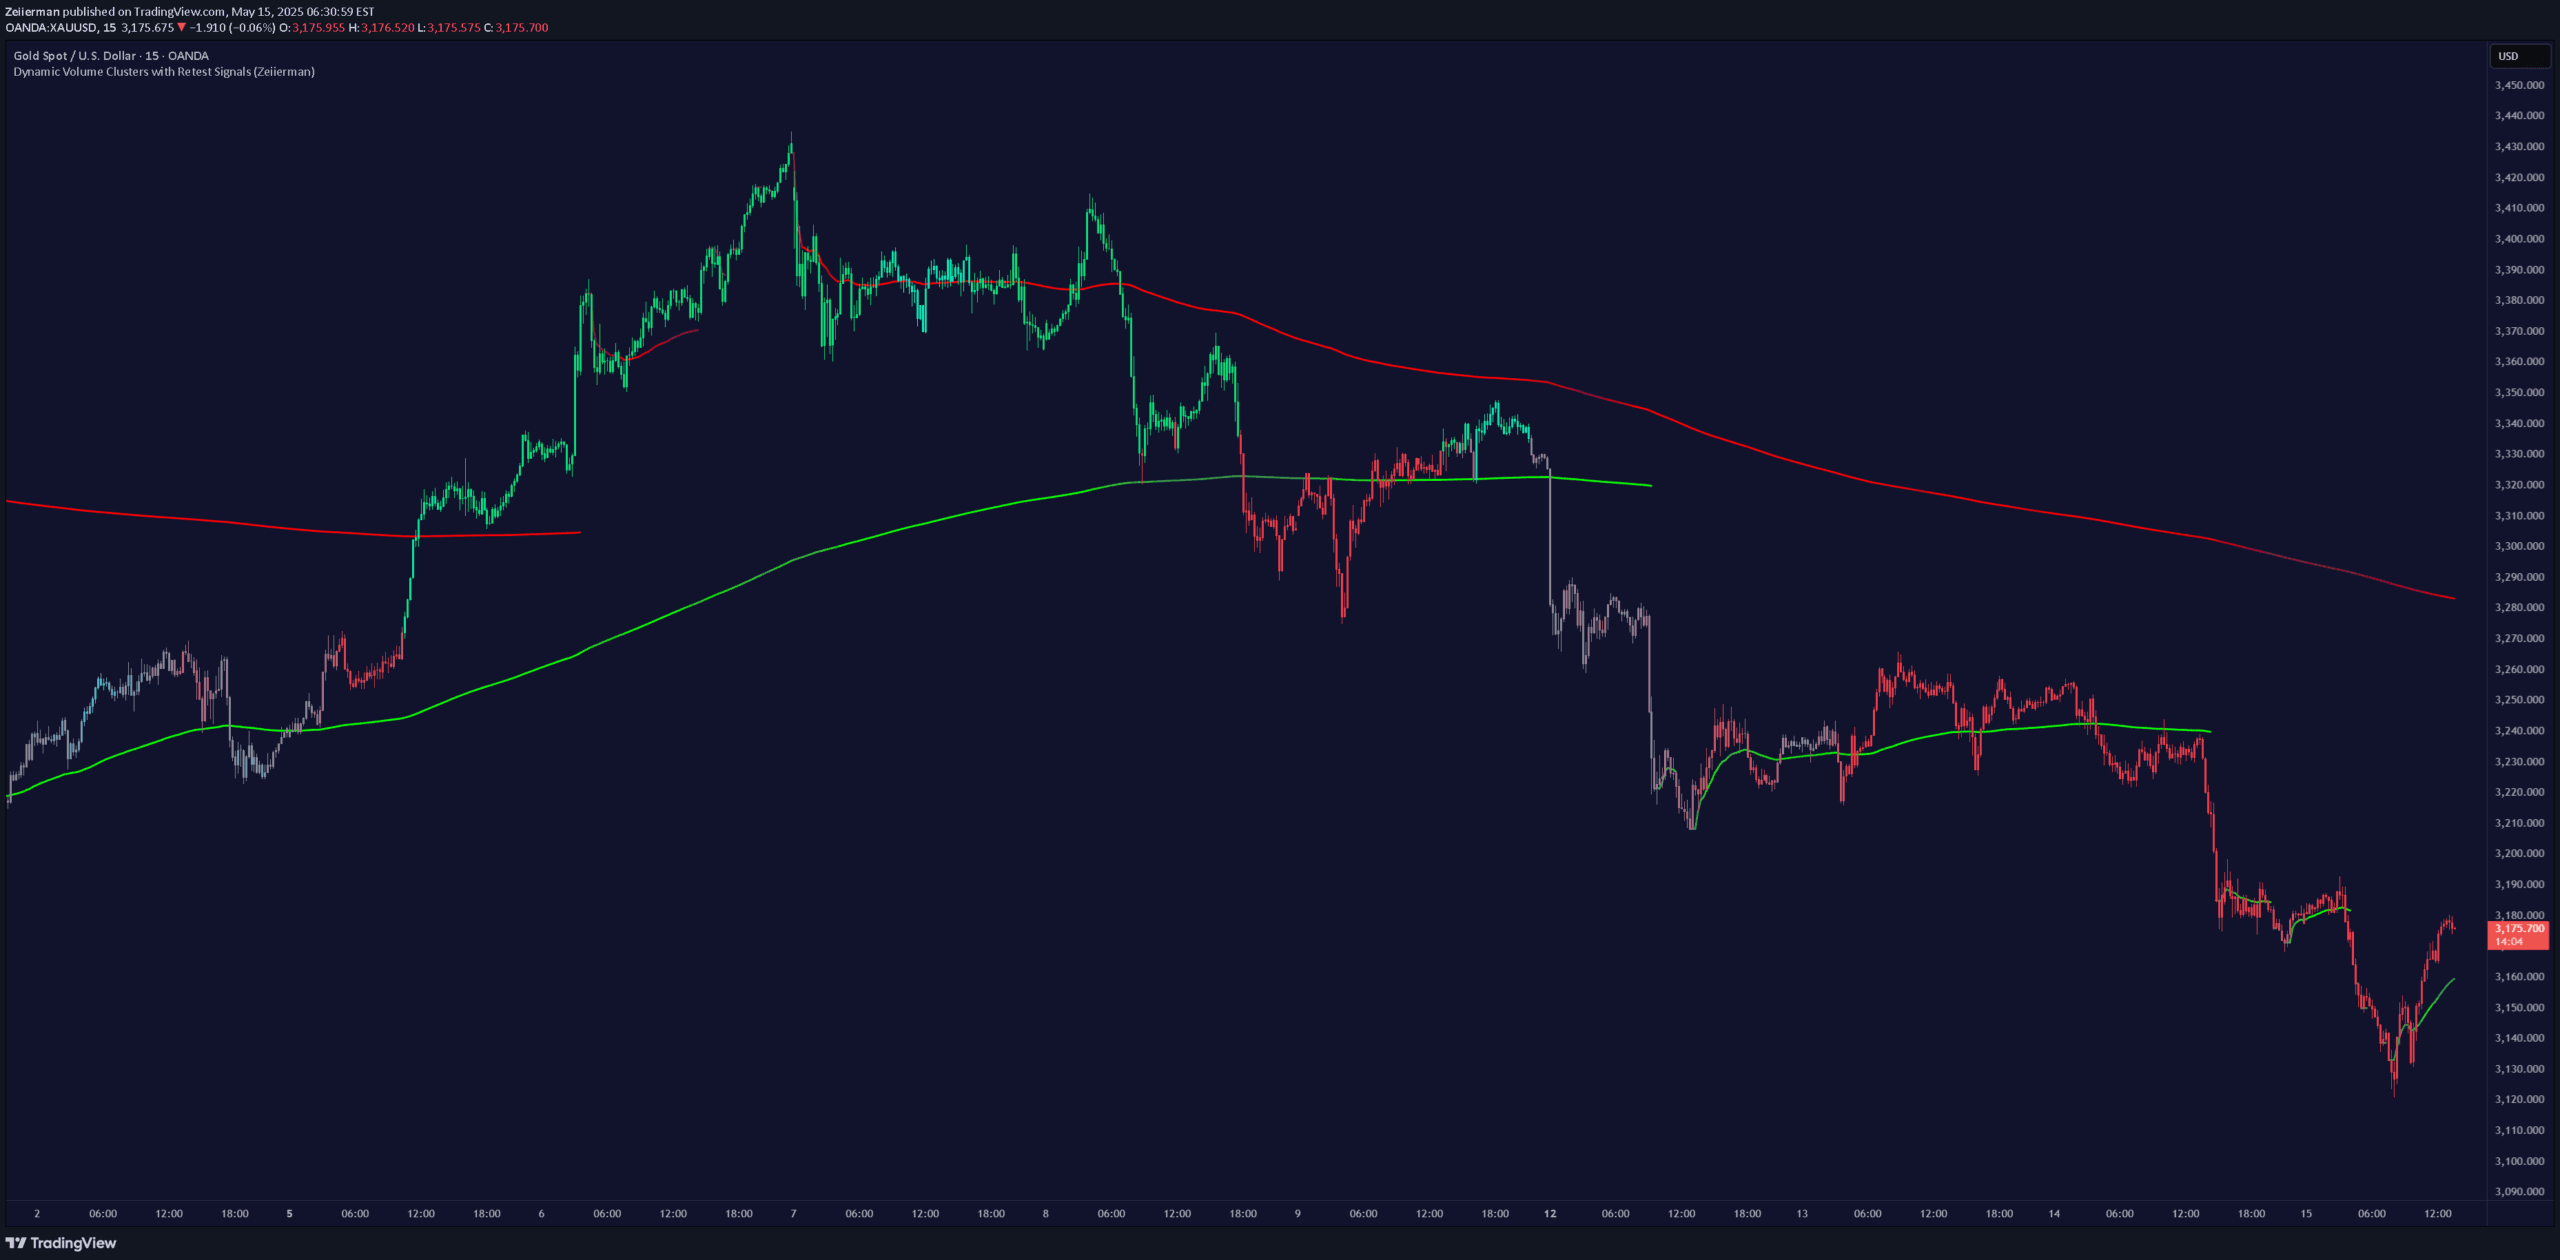
Dynamic volume clustering indicator that identifies key price zones with market memory, providing retest signals and insights into potential trend continuations or reversals.
Explore complementary indicator rolesHow it works
The Dynamic Volume Clusters indicator analyzes price movement and trading volume to create adaptive volume clusters that highlight areas of significant market activity. It calculates clusters by examining historical price points and volume density, using a dynamic moving average and Kalman Filter to smooth and refine the analysis.
The system identifies key zones through color-coded lines and candles, with bright lines representing strong market memory and faded lines indicating potential breakout areas. By tracking how frequently price revisits specific levels, the indicator generates retest signals that help traders understand potential support, resistance, and trend continuation points.
Why it may be useful
Traders need robust tools that can dynamically interpret market structure and volume behavior, and this indicator provides a comprehensive framework for understanding price dynamics. By mapping market memory and clustering, it offers insights beyond traditional price action analysis, helping traders identify high-probability trading zones and potential trend shifts.
The indicator's adaptive nature means it can respond to changing market conditions, providing real-time insights into volume concentration and potential price movements. This makes it valuable for traders seeking to understand underlying market mechanics and make more informed trading decisions across different timeframes and market environments.
When to explore it
The Dynamic Volume Clusters indicator works best in markets with clear directional movements and significant volume activity, such as major forex pairs, stock indices, and liquid commodities. Traders should prioritize using this tool during periods of established trends and when looking to confirm potential trend continuations or reversals.
The indicator is particularly effective when combined with other technical analysis tools, helping traders validate signals and identify high-probability entry and exit points. It's most powerful when used on timeframes from 5 minutes to daily charts, offering insights for scalpers, day traders, and swing traders seeking a nuanced understanding of market structure.
Keep exploring
What we’ve verified
Access, alerts and repainting behaviour have not been independently verified for this indicator. Check the creator’s current publication and settings.
General descriptions and classifications are recovered research. Verified details above identify the specific checks we have completed. Check the creator’s current publication for later changes.


