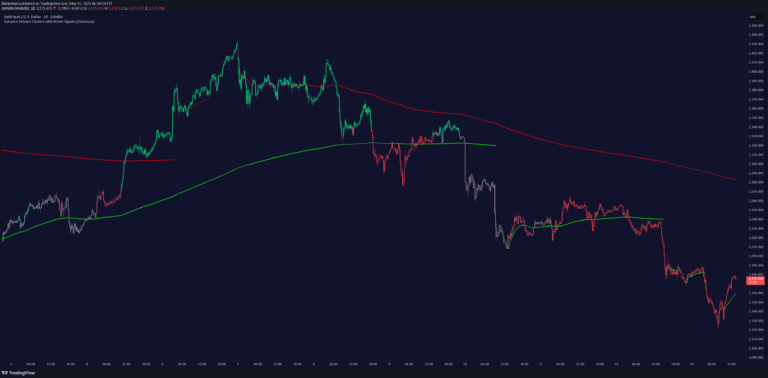
Machine Learning Adaptive SuperTrend [AlgoAlpha]
A machine learning-powered SuperTrend indicator that uses k-means clustering to dynamically adapt to market volatility, providing intelligent trend identification and volatility insights.
Explore 11,183 indicators. Filter beyond the obvious.
Discover the tools that fit the way you trade.
11,183 tools to explore
A machine learning-powered SuperTrend indicator that uses k-means clustering to dynamically adapt to market volatility, providing intelligent trend identification and volatility insights.
SuperTrend AI is an advanced machine learning technique that applies K-means clustering to the SuperTrend indicator, dynamically adapting trailing stop settings based on performance metrics.
K-means clustering algorithm identifies potential support and resistance levels by grouping similar price data points, offering traders insights into market behavior and potential price reversals.
A trading indicator that identifies potential liquidation levels by analyzing volume data and tracking leveraged positions across different market conditions.
AI Channels indicator uses K-means clustering to identify trend directions and potential price breakouts by analyzing price clusters and their centroids dynamically.
An AI-powered SuperTrend clustering oscillator that identifies market trends by analyzing multiple SuperTrend indicators through k-means clustering, providing bullish, bearish, and consensus outputs.
A machine learning-powered trendline indicator that uses k-means clustering to automatically identify and filter price trend clusters, offering dynamic trend visualization and analysis.
A machine learning-enhanced RSI indicator that dynamically adapts overbought and oversold thresholds using clustering techniques, providing more precise trading signals across different market conditions.
AI-powered Money Flow Index that uses machine learning to dynamically adapt MFI parameters, providing real-time insights into market trends and volume analysis.
Rolling VWAP Channel creates a dynamic indicator using multiple Volume Weighted Average Prices to analyze price clusters and potential market directional changes through percentile interpolation.
A machine learning-powered indicator that dynamically identifies support and resistance levels using advanced clustering techniques to help traders spot potential market reversal points and key price zones.
Dynamic volume clustering indicator that identifies key price zones with market memory, providing retest signals and insights into potential trend continuations or reversals.
Likes, views, and comments are historical TradingView snapshots. They describe attention, not trading performance.