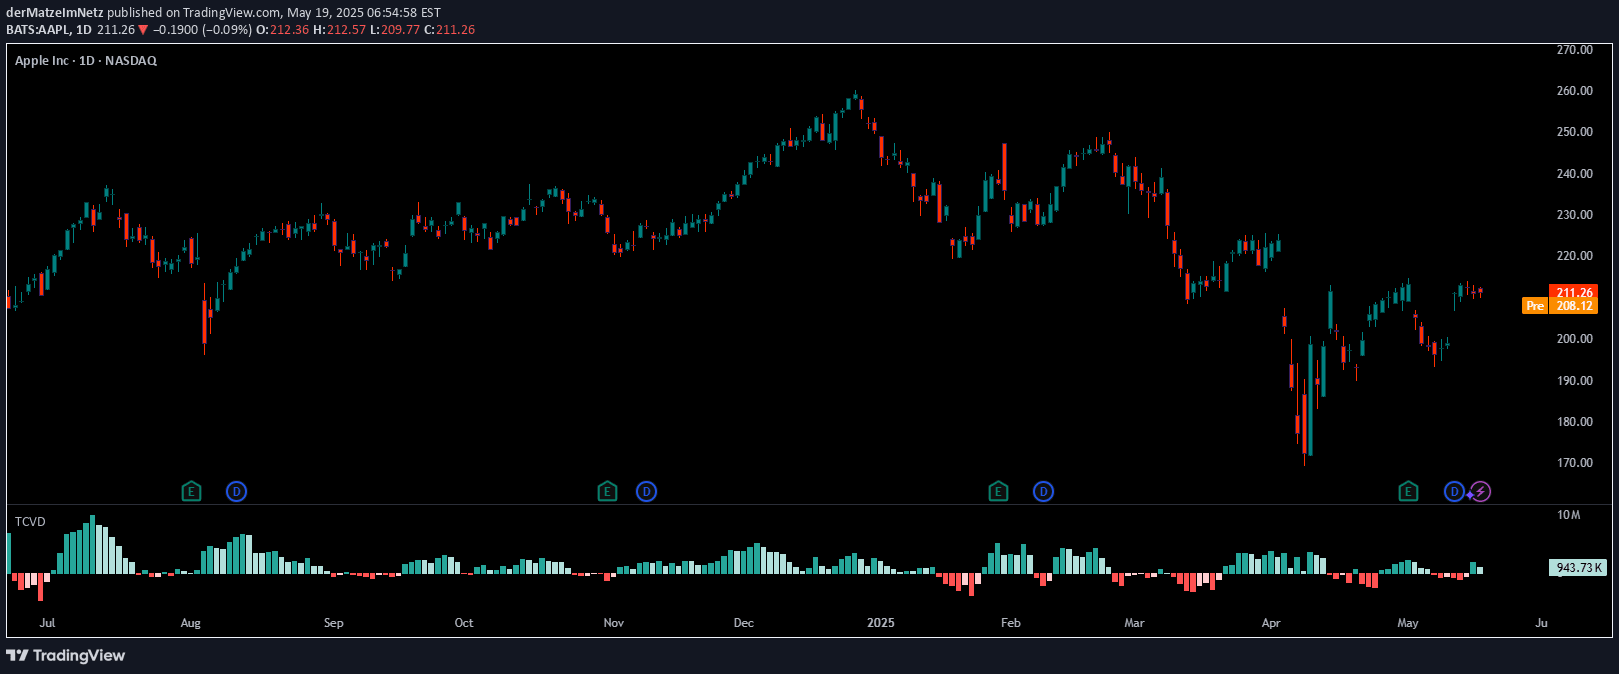
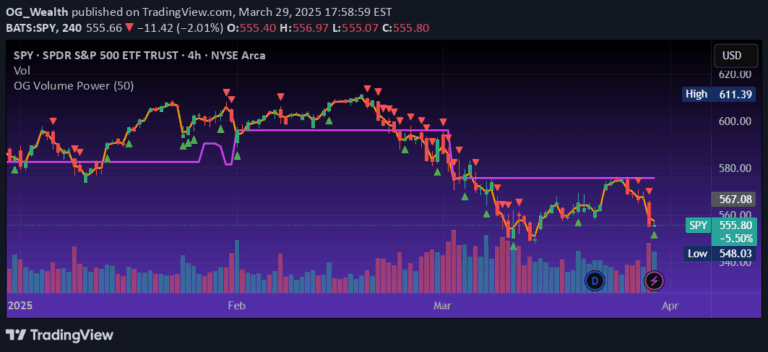
A volume analysis tool showing estimated buy and sell volume through colored histogram bars and a cumulative delta line, providing visual insight into market momentum and control.
Explore complementary indicator rolesHow it works
The Mirrored Buy/Sell Volume Histogram estimates trading volume by calculating the proportion of volume based on price candle positioning. Green bars above zero represent estimated buy volume, while red bars below zero indicate estimated sell volume. The calculation uses the relationship between the close price, low price, and high price to determine the buy volume proportion.
The blue cumulative delta line tracks the running total of buy volume minus sell volume over time. This provides a dynamic visualization of which side is gaining market control. The indicator creates a real-time snapshot of trading momentum by showing the balance between buying and selling pressure through color-coded volume estimations.
Why it may be useful
The Mirrored Buy/Sell Volume Histogram offers traders a nuanced view of market dynamics beyond traditional price and volume analysis. By estimating the directional volume, traders can gain insights into the underlying sentiment and potential trend shifts before they become visually apparent on price charts.
The cumulative delta line helps traders understand the gradual accumulation of buying or selling pressure. This visualization provides a more comprehensive understanding of market participation and momentum. Traders can quickly assess whether buyers or sellers are gaining control, which can be crucial for making informed trading decisions and identifying potential trend reversals or continuations.
When to explore it
The Mirrored Buy/Sell Volume Histogram is most effective during periods of active trading with clear price movements. It works best when combined with other technical analysis tools like trend indicators or oscillators to confirm potential trade signals. Traders can use this indicator to spot early momentum shifts and gauge market sentiment during volatile market conditions.
This tool is particularly useful for short-term trading strategies, especially in markets with high liquidity and frequent price fluctuations. Scalpers and day traders can leverage this indicator to make quick decisions about market entry and exit points, using the volume estimation and cumulative delta as additional confirmation of their trading thesis.
Keep exploring
What we’ve verified
Access, alerts and repainting behaviour have not been independently verified for this indicator. Check the creator’s current publication and settings.
General descriptions and classifications are recovered research. Verified details above identify the specific checks we have completed. Check the creator’s current publication for later changes.