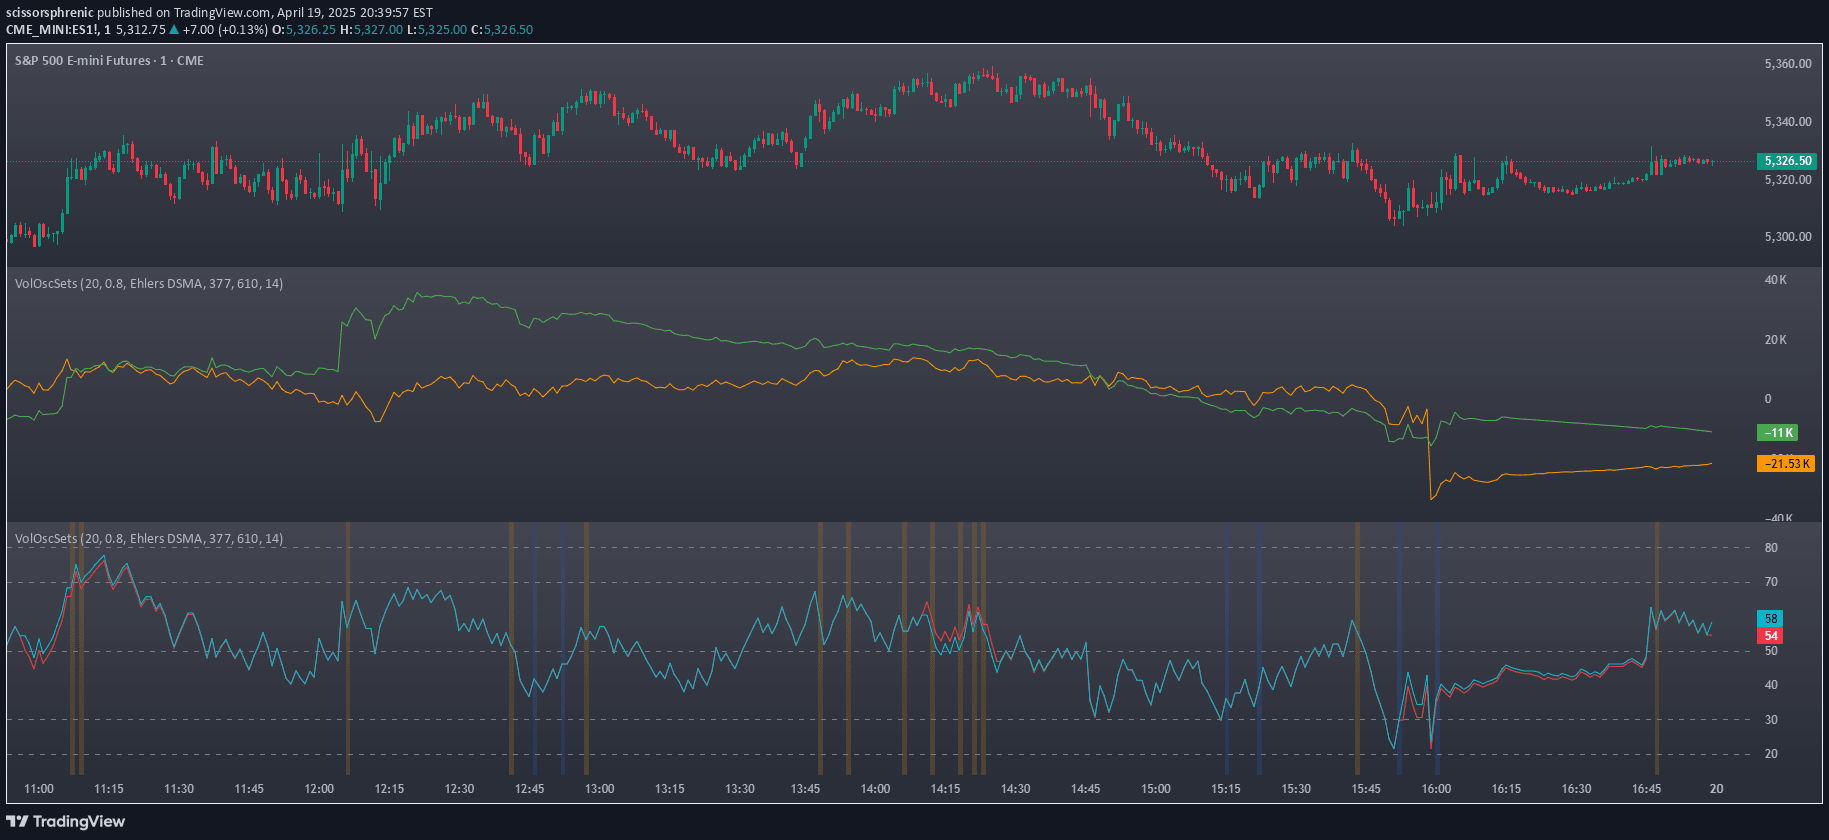
Volume Accumulation Oscillator assesses volume strength and market momentum by analyzing net volume accumulation and exponential moving averages to identify potential trend shifts.
Explore complementary indicator rolesHow it works
The Volume Accumulation Oscillator (VAO) calculates Net Volume Accumulation by analyzing trading volume in relation to price movements, incorporating open, close, high, and low prices. It applies exponential moving averages to smooth the net volume data, creating a refined momentum indicator that tracks volume dynamics.
The indicator generates a line chart and histogram representing volume accumulation, with positive and negative values indicating bullish or bearish volume pressure. By comparing smoothed Net Volume Accumulation against its own exponential moving average, the VAO provides a nuanced view of potential market momentum and trend strength.
Why it may be useful
The Volume Accumulation Oscillator offers traders a sophisticated tool for understanding market dynamics by revealing underlying volume trends that may not be immediately apparent from price action alone. It provides insights into potential trend reversals and the strength of buying or selling pressure, helping traders make more informed decisions.
By visualizing volume accumulation through color-coded histograms and reference levels, the VAO helps traders identify critical market turning points and assess the sustainability of current price movements. This comprehensive approach allows for more strategic entry and exit points in various market conditions.
When to explore it
The Volume Accumulation Oscillator is most effective in markets with clear volume trends and significant price movements, such as stocks, forex, and cryptocurrency trading. It performs best when combined with other technical analysis tools to confirm signals and provide a more comprehensive market assessment.
Traders should pay special attention to VAO divergences from price charts, zero-line crossovers, and extreme positive or negative readings. The indicator is particularly useful during trending markets and can help identify potential momentum shifts before they become apparent through price action alone.
Keep exploring
What we’ve verified
Access, alerts and repainting behaviour have not been independently verified for this indicator. Check the creator’s current publication and settings.
General descriptions and classifications are recovered research. Verified details above identify the specific checks we have completed. Check the creator’s current publication for later changes.