ADX and DI
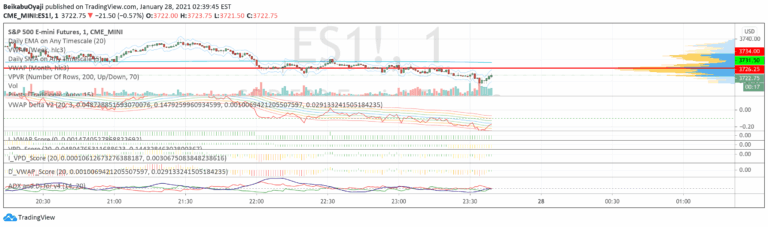
ADX measures trend strength and direction by analyzing price movement. It helps traders identify the presence and power of a trend, indicating whether a market is trending or ranging.
Explore 11,183 indicators. Filter beyond the obvious.
Discover the tools that fit the way you trade.
11,183 tools to explore
ADX measures trend strength and direction by analyzing price movement. It helps traders identify the presence and power of a trend, indicating whether a market is trending or ranging.
A market structure break and order block indicator that identifies trend reversals by analyzing price action breakouts and key candle formations to signal potential trading opportunities.
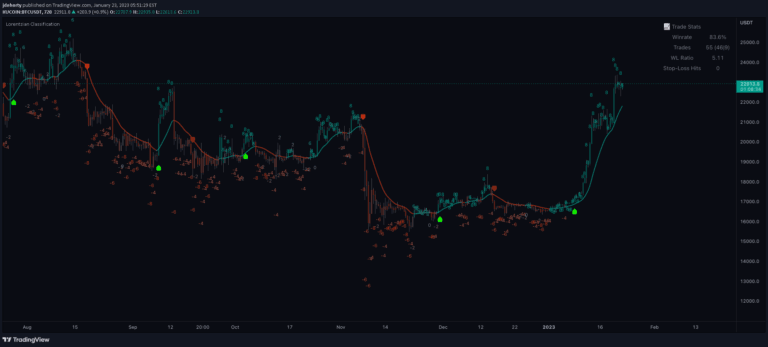
A machine learning trading signal using Lorentzian Distance Classifier to predict price movements by analyzing historical data patterns and identifying nearest neighbors in a multi-dimensional feature space.
Advanced trading tool that detects divergences across multiple technical indicators, helping traders identify potential trend reversals and momentum shifts through comprehensive pivot point analysis.
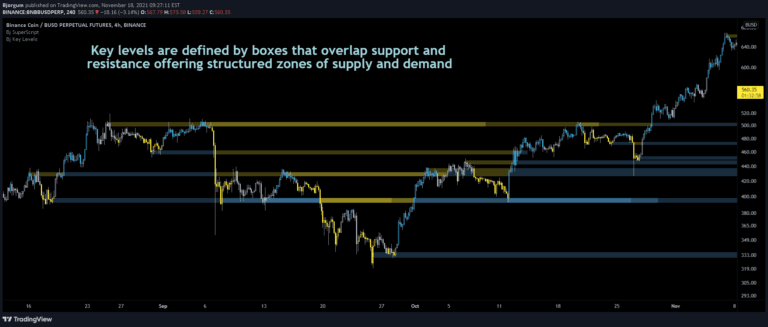
Key Levels strategy identifies critical price action points like breakouts, false breakouts, and backchecks to help traders understand market movement and potential trading opportunities.
Breakout Probability indicator calculates the likelihood of new market highs or lows by analyzing historical price action and displaying percentage probabilities for potential price levels.
Ichimoku Kinko Hyo is a comprehensive technical indicator that provides insights into trend direction, momentum, and potential support and resistance levels using multiple components.
A multi-indicator divergence script that analyzes divergences across 10 different technical indicators to identify potential trend reversals and price movements.
CM MACD Ultimate Multi-Timeframe V2 is an advanced MACD indicator with enhanced customization options, multi-timeframe analysis, and comprehensive trend visualization features.
A Linear Regression Channel indicator that tracks price trends, identifies channel breakouts, and analyzes momentum direction using dynamic visual signals and customizable settings.
An advanced all-in-one trading strategy builder that combines over 30 indicators to generate custom buy and sell signals across multiple timeframes and trading styles.
Elliott Wave indicator automatically detects impulse and corrective wave patterns in price movements, helping traders identify potential trend directions and market phases.
Likes, views, and comments are historical TradingView snapshots. They describe attention, not trading performance.