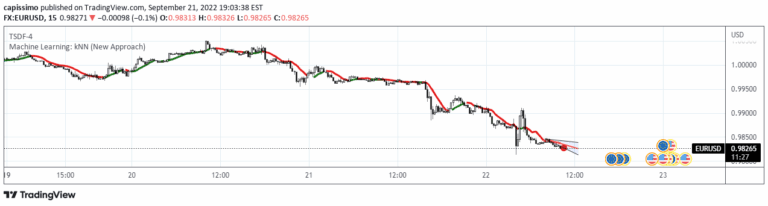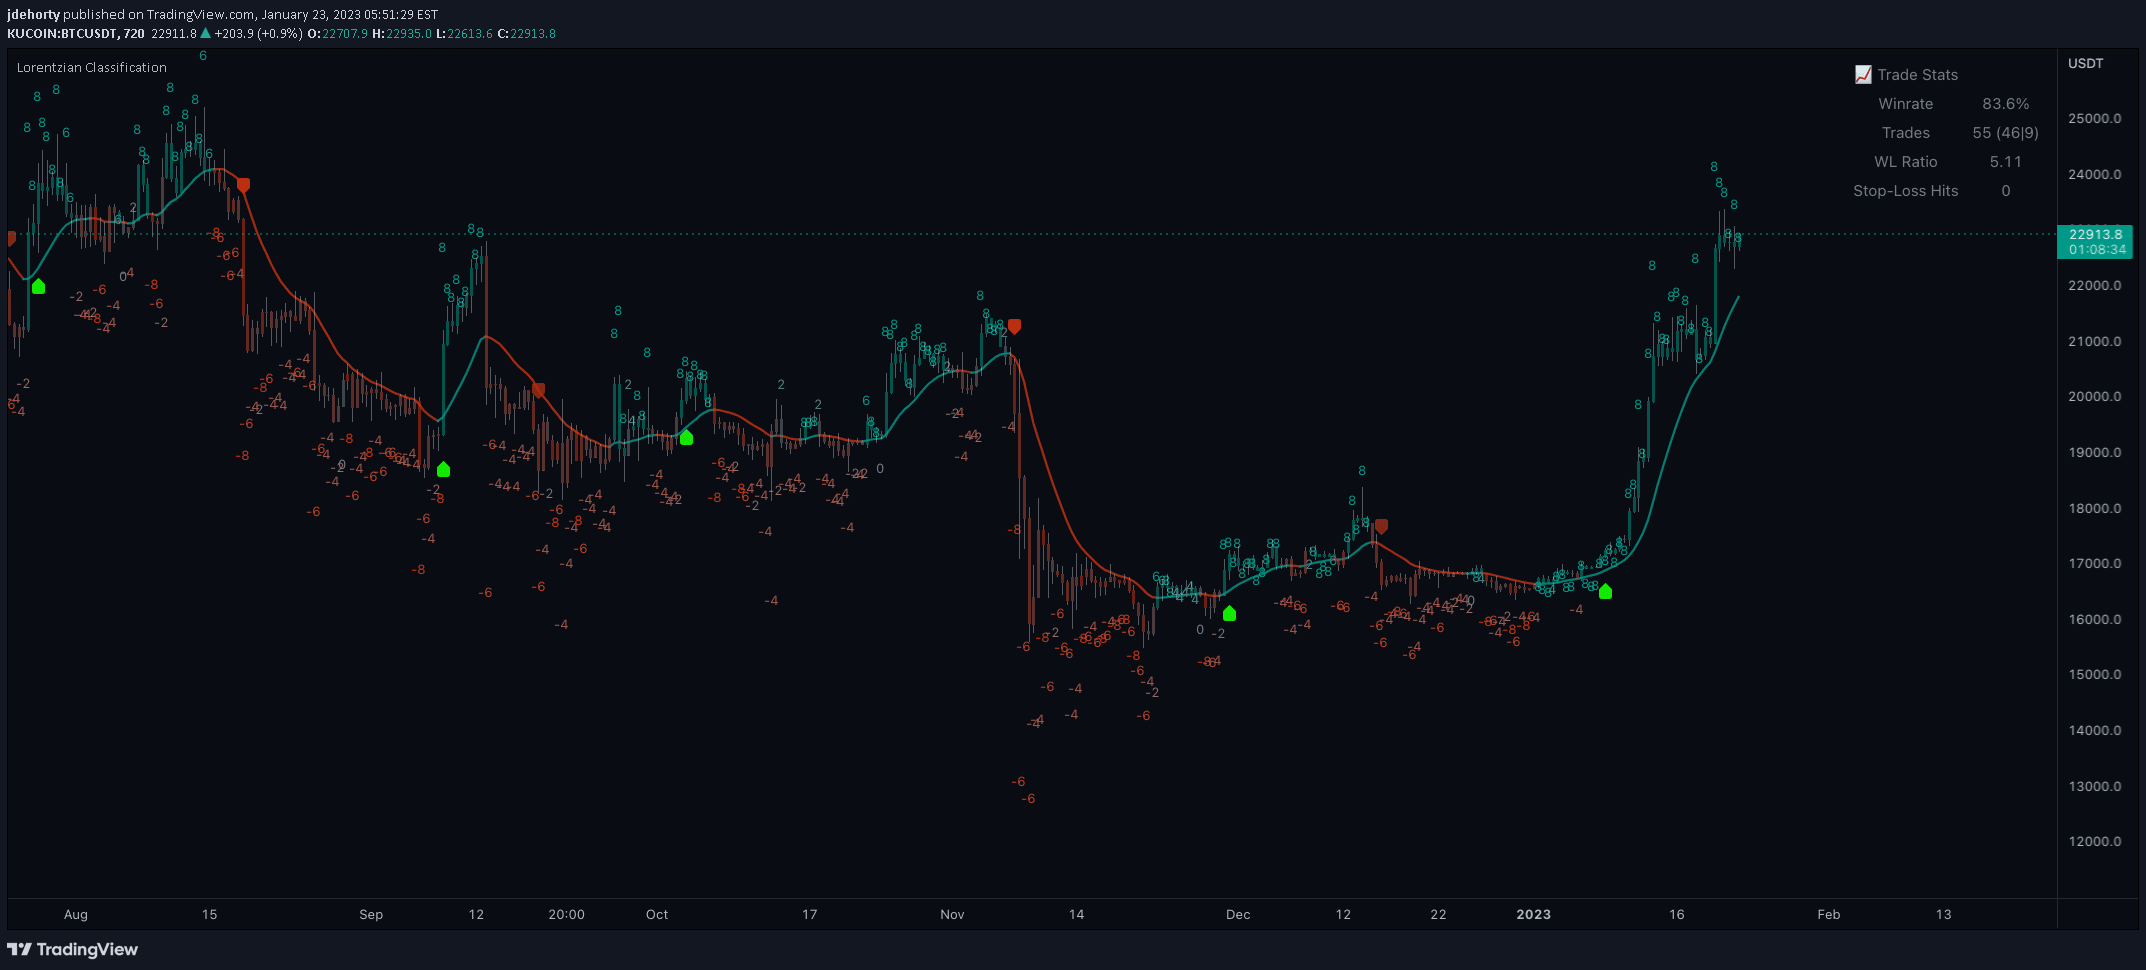
A machine learning trading signal using Lorentzian Distance Classifier to predict price movements by analyzing historical data patterns and identifying nearest neighbors in a multi-dimensional feature space.
Explore complementary indicator rolesHow it works
The Lorentzian Distance Classifier works by mapping historical price data points into a multi-dimensional feature space using multiple technical indicators like RSI, Weighted Trend, CCI, and ADX.
It then calculates distances between data points using a specialized Lorentzian distance metric that better accounts for market event warping. By identifying the closest historical neighbors, the algorithm can predict potential future price movements with greater accuracy than traditional Euclidean distance methods
Why it may be useful
This advanced machine learning approach transcends traditional distance metrics by capturing complex market dynamics that standard algorithms might miss. It provides traders with a more nuanced predictive tool that can identify similar historical market conditions across different timeframes and market regimes.
The Lorentzian Distance Classifier offers improved robustness against market noise and outliers, potentially delivering more reliable trading signals by considering contextual similarities beyond simple numerical proximity
When to explore it
The Lorentzian Distance Classifier is most effective in markets with significant event-driven price movements and complex market conditions. It performs best on 4-12 hour timeframes and works well across various assets with sufficient historical data.
Traders should use this signal when seeking advanced predictive insights that go beyond traditional technical analysis, particularly in markets prone to sudden shifts or influenced by macroeconomic events
Keep exploring
What we’ve verified
Reviewed 2026-10-20 · Published source labelled Lorentzian Classification v2.0, viewed 20 October 2026
- Access
- Free, open-source publicationSource checked
TradingView exposes the script’s Pine source, including its imported library references.
- Alerts
- Entry, exit and kernel-change alertsSource checked
Source definitions cover long and short entries/exits, combined position alerts, and bullish/bearish kernel colour changes.
- Repainting & timing
- Closed-bar stability is creator-statedCreator stated
The creator says predictions and the kernel estimate remain stable after a candle closes. The source’s settings acknowledge intrabar changes. We have not independently tested this claim or all imported library behaviour.
Publication and top-level source review. The built-in trade statistics are not an independently verified backtest.
Review the creator’s publication ↗General descriptions and classifications are recovered research. Verified details above identify the specific checks we have completed. Check the creator’s current publication for later changes.