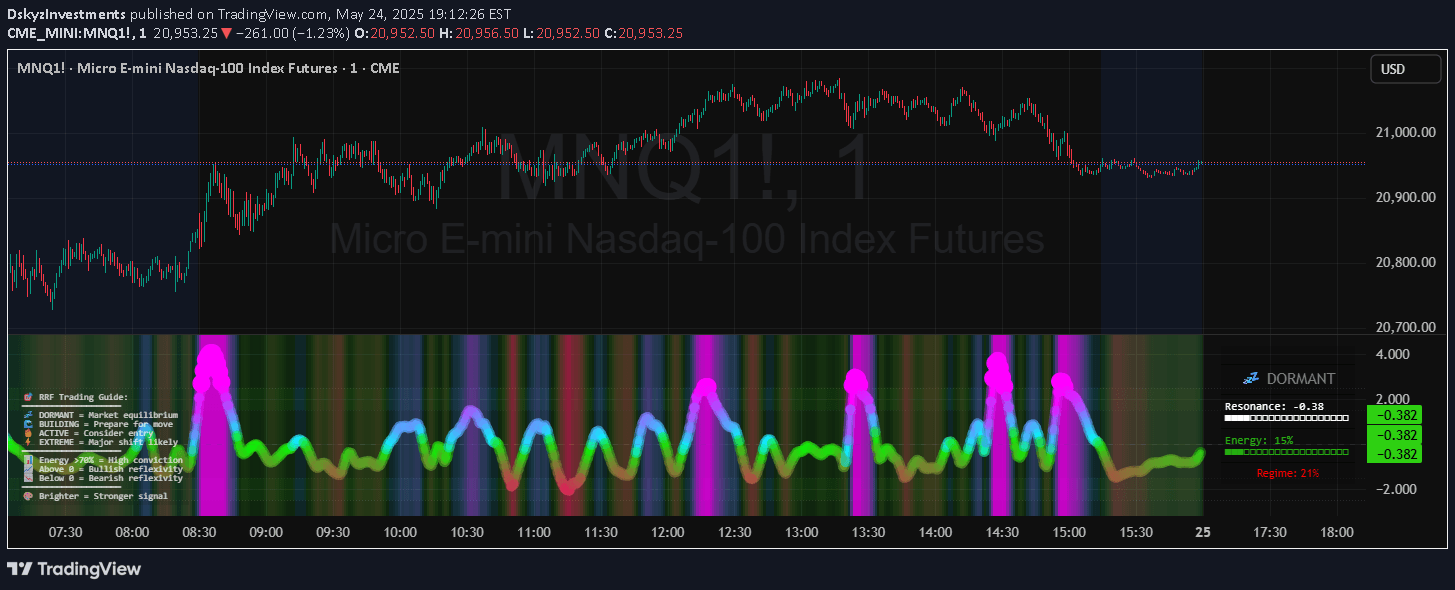
An advanced momentum indicator using Rational Quadratics to analyze trend strength, visualize potential movement zones, and generate multiple momentum signals across different market conditions.
Explore complementary indicator rolesHow it works
The AI Momentum Indicator operates by creating Rational Quadratic zones using highest highs and lowest lows, which establish inner and outer boundaries for potential price movement. It calculates momentum through multiple signal types, including bullish and bearish momentum, which track price movement relative to smoothed volume-weighted moving averages.
The indicator generates signals by comparing rationalized close prices against different moving averages and zones, creating complex momentum assessments. These signals include standard momentum indicators, overly bullish/bearish momentum signals, and unique bull and bear crosses that help predict potential trend changes.
Why it may be useful
The AI Momentum Indicator provides traders with a sophisticated tool for understanding market dynamics beyond traditional momentum analysis. By incorporating rational quadratic smoothing and multiple signal types, it offers deeper insights into potential trend strength, direction, and possible reversals.
Traders benefit from its comprehensive approach, which combines visual zone representations with nuanced momentum signals. The indicator helps identify not just when momentum exists, but also potential transition points, making it a valuable tool for strategic decision-making across different market conditions.
When to explore it
The AI Momentum Indicator is most effective in markets with clear trending characteristics, where price movements demonstrate consistent directional momentum. It works particularly well in markets experiencing moderate to high volatility, where multiple momentum signals can provide robust trading insights.
Traders should utilize this indicator when seeking to confirm trend strength, identify potential reversal zones, and understand the underlying momentum dynamics. It is especially useful during periods of market transition, where traditional momentum indicators might provide less clear signals.
Keep exploring
What we’ve verified
Access, alerts and repainting behaviour have not been independently verified for this indicator. Check the creator’s current publication and settings.
General descriptions and classifications are recovered research. Verified details above identify the specific checks we have completed. Check the creator’s current publication for later changes.