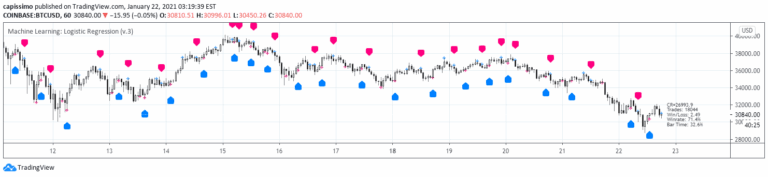
A machine learning trading indicator using logistic regression that combines multiple technical indicators to generate potential buy and sell signals with systematic decision-making.
Explore complementary indicator rolesHow it works
The Multiple Logistic Regression Indicator employs a sophisticated machine learning approach by integrating multiple technical indicators like RSI, CCI, DMI, Aroon, EMA, and SuperTrend. These indicators are first normalized to create consistent categorical variables that serve as input for the logistic regression model.
The model calculates a probability of market movement by applying a logistic regression function with user-defined coefficients. Through gradient descent optimization, the algorithm iteratively adjusts its weights to minimize the cross-entropy loss function, which measures the accuracy of predictions between 0 and 1.
Why it may be useful
This indicator provides traders with a sophisticated, data-driven approach to market analysis by synthesizing multiple technical indicators into a single predictive model. By combining various technical signals, it offers a more comprehensive view of market conditions than single-indicator strategies, potentially reducing false signals and improving trade decision accuracy.
The adaptive nature of the logistic regression model allows traders to dynamically adjust coefficients and learning rates, making it a flexible tool for different market environments. Its systematic approach helps traders move beyond subjective interpretations, introducing a more quantitative and algorithmic method of technical analysis.
When to explore it
The Multiple Logistic Regression Indicator is most effective in markets with clear trend characteristics and sufficient volatility, where multiple technical indicators can provide meaningful insights. It works best when traders can fine-tune its parameters through careful backtesting and validation across different market conditions and timeframes.
Traders should consider using this indicator in markets with consistent price movements, such as forex, stocks, and cryptocurrency markets. It is particularly useful for traders seeking a comprehensive, machine learning-based approach to technical analysis that goes beyond traditional single-indicator strategies.
Keep exploring
What we’ve verified
Access, alerts and repainting behaviour have not been independently verified for this indicator. Check the creator’s current publication and settings.
General descriptions and classifications are recovered research. Verified details above identify the specific checks we have completed. Check the creator’s current publication for later changes.