YOUR INDICATOR RESEARCH STARTS HERE

Find the right indicator.
Understand what it does.

Explore 11,183 indicators. Filter beyond the obvious.
Discover the tools that fit the way you trade.

THE INDICATOR LIBRARY

Explore the possibilities

11,183 tools to explore

30 indicators matching your filters
Save search
SignalTrend

Trend Strength Gauge

by VanHe1sing

A trend strength indicator using Modified Hull Moving Average with a visual gauge that shows trend direction and intensity through color and transparency gradients.

Main price chart · unverifiedScalping · Day Trading
Explore
2Klikes41.7Kviews25comments
Save
TrendVolatilityEditor’s pick

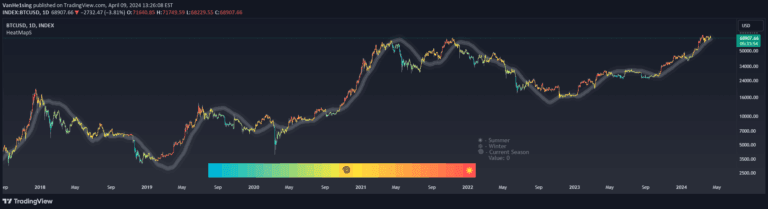
Heat Map Seasons

by VanHe1sing

Heat Map Seasons indicator visualizes market dynamics through seasonal trends, using regression analysis and color-coded heat map to highlight market volatility and potential sentiment shifts.

Main price chart · unverifiedSwing Trading
Explore
1.9Klikes72.1Kviews24comments
Save
OscillatorSignalTrend

MVRV Z Score

by VanHe1sing

MVRV Z-Score analyzes Bitcoin's market value and realized value to identify potential market tops and bottoms by measuring valuation extremes.

Separate pane · unverifiedSwing Trading
Explore
1.3Klikes31.9Kviews13comments
Save
TrendSignalLevels

BTC Valuation

by VanHe1sing

A Bitcoin valuation tool that assesses market value by comparing current price to moving averages and logarithmic trendlines, providing insights into potential trading opportunities.

Separate pane · unverifiedDay Trading · Swing Trading
Explore
1.3Klikes15Kviews9comments
Save
TrendVolatilityEditor’s pick

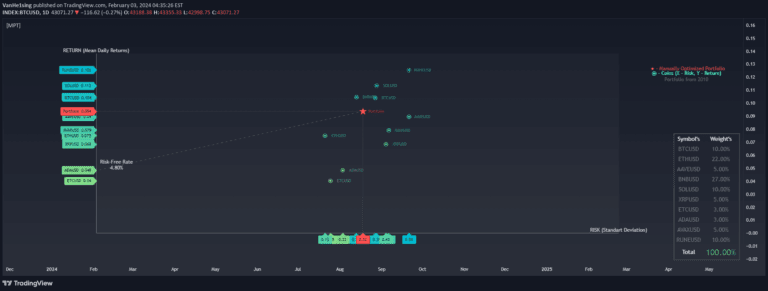
Modern Portfolio Theory

by VanHe1sing

A Modern Portfolio Theory tool that helps traders optimize investment allocations by analyzing risk and return across multiple assets using a comprehensive scatter plot visualization.

Separate pane · unverifiedSwing Trading
Explore
934likes44.7Kviews17comments
Save
SignalTrend

Cloud Trend

by VanHe1sing

A cloud trend indicator using Heikin Ashi principles to visualize market momentum and trend direction through a dual-line cloud with dynamic color-coded signals.

Main price chart · unverifiedScalping · Day Trading
Explore
881likes19.1Kviews7comments
Save
LevelsSignalTrend

Bitcoin Cycles Indicator

by VanHe1sing

Bitcoin Cycles Indicator tracks market phases by analyzing market cap and transaction volume, revealing potential Bitcoin market valuation stages across different cycle points.

Separate pane · unverifiedSwing Trading
Explore
858likes11Kviews7comments
Save
SignalTrend

Net Unrealized Profit/Loss (NUPL)

by VanHe1sing

Net Unrealized Profit/Loss (NUPL) analyzes Bitcoin investor sentiment by comparing market value to realized value, revealing potential market overheating or profit-taking opportunities.

Separate pane · unverifiedSwing Trading
Explore
740likes23.9Kviews7comments
Save
SignalTrend

Trend Finder

by VanHe1sing

A powerful trend detection indicator that identifies market direction and potential reversal points by analyzing moving averages and price movements across multiple timeframes.

Separate pane · unverifiedScalping · Day Trading
Explore
725likes16.6Kviews6comments
Save
OscillatorSignalVolatility

Z Score

by VanHe1sing

Z-scored VIX indicator measures market volatility expectations using standard deviation from the mean, providing insights into potential S&P 500 trend reversals.

Separate pane · unverifiedScalping · Day Trading
Explore
709likes11.7Kviews7comments
Save
SignalTrendVolatility

Active Addresses

by VanHe1sing

A Bitcoin sentiment indicator comparing 28-day price changes with active address changes to predict potential market reversals and short-term price movements.

Separate pane · unverifiedDay Trading · Swing Trading
Explore
700likes12.4Kviews2comments
Save

Likes, views, and comments are historical TradingView snapshots. They describe attention, not trading performance.

START WITH A QUESTION

A little less searching.
A lot more understanding.

Tell DeepAlpha what you need. Get an explanation, a shortlist,
and a direct path to the indicators behind it.

Ask DeepAlpha