
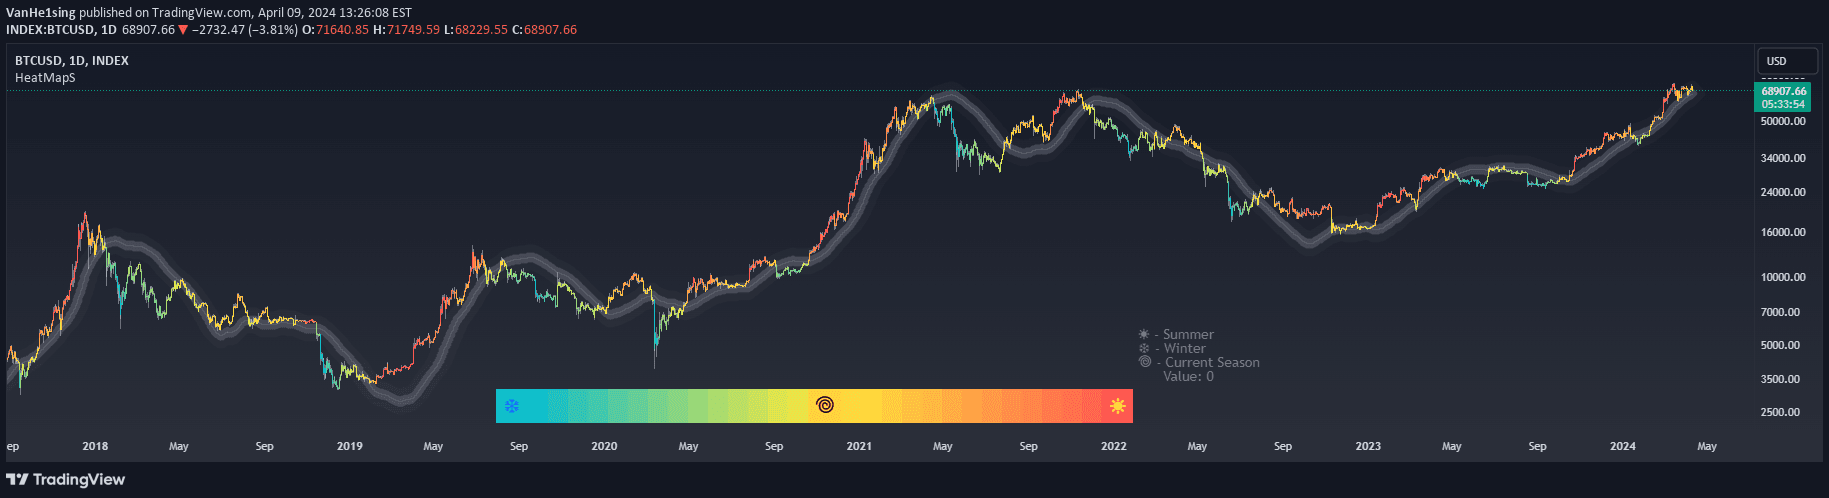
Heat Map Seasons indicator visualizes market dynamics through seasonal trends, using regression analysis and color-coded heat map to highlight market volatility and potential sentiment shifts.
Explore complementary indicator rolesHow it works
The Heat Map Seasons indicator operates by analyzing price movements through regression analysis, creating a color-coded heat map that represents market dynamics. It tracks deviations from a regression line, using different color intensities to signal market conditions. The indicator calculates price momentum and volatility, comparing current price action to historical trends.
It generates a seasonal gauge that shows market sentiment through warm and cool color gradients. The length of regression analysis and heat sensitivity can be customized to suit different trading styles. By visualizing these market nuances, traders can quickly interpret complex price movements
Why it may be useful
The Heat Map Seasons indicator provides traders with a unique perspective on market behavior by transforming complex price data into an easily interpretable visual format. It helps traders identify potential market tops and bottoms by highlighting significant price deviations. The color-coded system allows quick recognition of market sentiment and volatility levels.
Traders can use this information to adjust their strategies proactively, reducing risk and improving decision-making. By offering insights into market momentum and potential trend reversals, the indicator serves as a valuable tool for understanding market psychology. It bridges the gap between raw price data and actionable trading insights
When to explore it
The Heat Map Seasons indicator works best during periods of significant market movement and when traders want to assess overall market sentiment. It is particularly useful on weekly timeframes where longer-term trends become more apparent. Traders should utilize this indicator when seeking to identify potential market tops and bottoms, or when wanting to understand underlying market dynamics.
It is most effective in markets with clear trending or consolidating characteristics. The indicator can be especially valuable during transitional market phases where identifying sentiment shifts is crucial. Combining it with other technical analysis tools can provide more comprehensive market insights
Keep exploring
What we’ve verified
Access, alerts and repainting behaviour have not been independently verified for this indicator. Check the creator’s current publication and settings.
General descriptions and classifications are recovered research. Verified details above identify the specific checks we have completed. Check the creator’s current publication for later changes.


