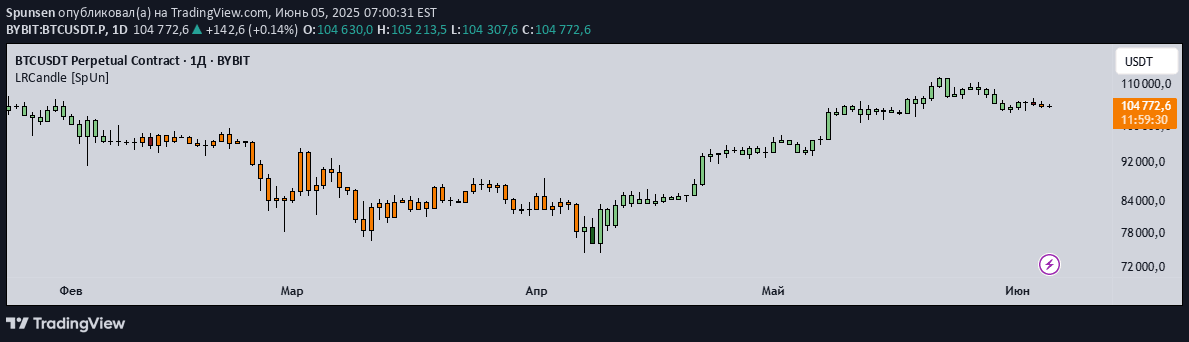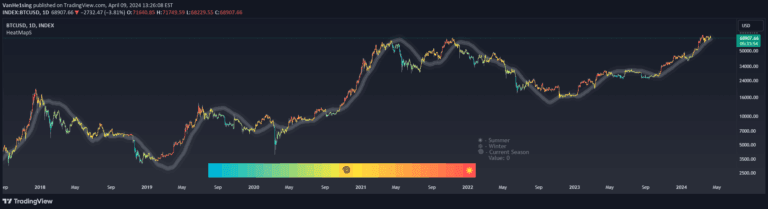
Heat Map Seasons
Heat Map Seasons indicator visualizes market dynamics through seasonal trends, using regression analysis and color-coded heat map to highlight market volatility and potential sentiment shifts.
Main price chart · unverifiedSwing Trading
Explore 1.9Klikes72.1Kviews24comments