
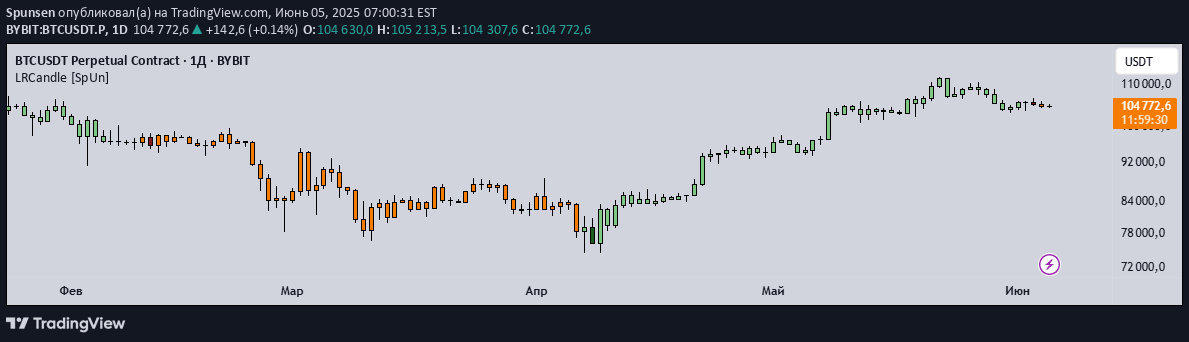
LRC is a linear regression-based indicator that smooths price candles, reducing market noise and providing trend confirmation through color-coded signals and crossovers.
Explore complementary indicator rolesHow it works
The Linear Regression Candle (LRC) uses statistical linear regression to calculate synthetic Open, High, Low, and Close values for price candles. By fitting a linear line through price data points, it creates smoother candles that filter out market noise and provide a clearer trend visualization.
The indicator generates color-coded candles based on the relationship between regression open and close prices. Green candles indicate bullish momentum when the regression open crosses above the close, while red candles signal bearish momentum when the regression open crosses below the close.
Why it may be useful
The LRC indicator helps traders cut through market volatility by presenting a more normalized view of price action. By smoothing price data, it reduces false signals and provides a clearer perspective on underlying market trends, making it easier to identify potential entry and exit points.
Its color-coded system allows quick visual interpretation of market conditions, helping traders rapidly assess whether a market is in a bullish, bearish, or neutral state. The ability to adjust regression length and apply multi-timeframe analysis further enhances its versatility and analytical power.
When to explore it
The LRC works best in markets with clear trending behavior, where price movements are more directional and less choppy. It is particularly effective when combined with other trend-confirmation indicators, helping traders validate potential trade setups across different timeframes.
Traders should utilize the LRC during periods of moderate volatility, where its smoothing capabilities can effectively filter out minor price fluctuations. It is especially useful for identifying trend reversals, confirming momentum shifts, and providing early warning signals in various markets like stocks, forex, and cryptocurrencies.
Keep exploring
What we’ve verified
Access, alerts and repainting behaviour have not been independently verified for this indicator. Check the creator’s current publication and settings.
General descriptions and classifications are recovered research. Verified details above identify the specific checks we have completed. Check the creator’s current publication for later changes.


