A multi-timeframe indicator that analyzes higher timeframe candle sentiments and colors current chart candles based on dominant market direction across selected timeframes.
Explore complementary indicator rolesHow it works
The HTF Candle Consistency indicator analyzes recent candles across multiple higher timeframes, calculating their directional sentiment through a weighted analysis. By examining up to 10 different timeframes, the indicator assigns weights to each timeframe's recent price movement, allowing traders to customize their analysis.
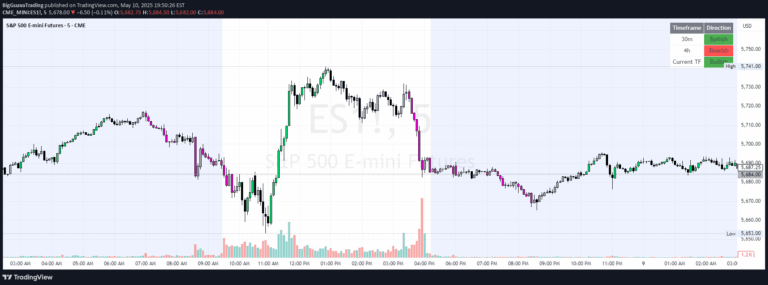
The script then determines the dominant market sentiment by aggregating these weighted calculations. If the majority of selected timeframes show bullish momentum, the current chart's candle will be colored green, while predominantly bearish momentum results in a red candle color. A third 'tricolor' mode allows for more nuanced sentiment detection when no clear majority exists.
Why it may be useful
Multi-timeframe analysis helps traders filter out market noise and understand broader price trends beyond their current chart timeframe. By providing a comprehensive view of market sentiment across different time horizons, traders can make more informed decisions about potential trade entries and exits.
The indicator's flexibility in timeframe selection and weighting allows traders to adapt their analysis to different market conditions and trading styles. The accompanying dashboard provides additional transparency by displaying directional readouts for each selected timeframe, enabling traders to quickly assess overall market momentum.
When to explore it
This indicator is most effective when traders want to align their trades with higher timeframe trends and reduce the impact of short-term market fluctuations. It works best when used on timeframes equal to or lower than the current chart timeframe to ensure data accuracy and meaningful analysis.
Traders can leverage this tool during trending markets or when seeking to confirm trend strength across multiple timeframes. It is particularly useful for day and swing traders who need to understand broader market context before entering or exiting positions, providing a structured approach to multi-timeframe trend analysis.
Keep exploring
What we’ve verified
Access, alerts and repainting behaviour have not been independently verified for this indicator. Check the creator’s current publication and settings.
General descriptions and classifications are recovered research. Verified details above identify the specific checks we have completed. Check the creator’s current publication for later changes.