HTF Liquidity Levels
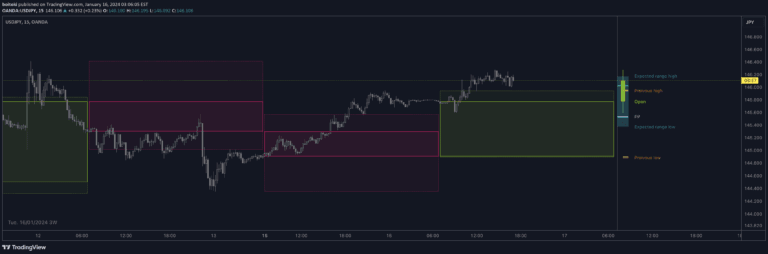
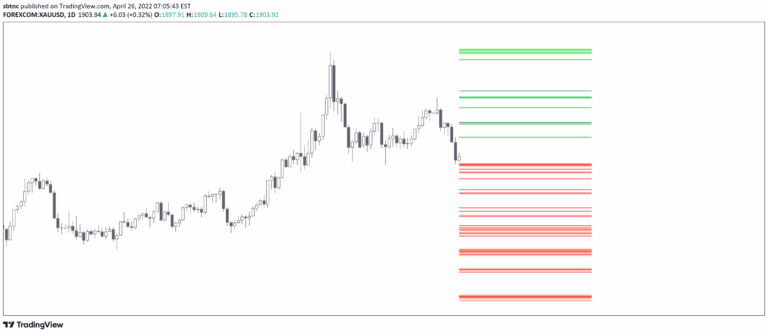
A trading indicator that identifies untapped liquidity levels across different timeframes, helping traders understand potential price movement magnets and liquidity pools in the market.
Explore 11,183 indicators. Filter beyond the obvious.
Discover the tools that fit the way you trade.
11,183 tools to explore
A trading indicator that identifies untapped liquidity levels across different timeframes, helping traders understand potential price movement magnets and liquidity pools in the market.
A trading indicator that detects breakouts from previous higher timeframe high and low levels, providing take-profit and stop-loss levels with advanced filtering for false breakouts.
A configurable higher timeframe indicator that allows visualization of price movement, Fair Value Gaps, and Volume Imbalance across multiple timeframes for strategic trading analysis.
A higher timeframe indicator that identifies and visualizes fair value gaps in price movement, highlighting potential trading opportunities through color-coded background and candle representations.
A multi-symbol scanner that tracks price movements against previous day, week, and month highs and lows, providing visual and alert-based tracking of key market levels.
A comprehensive trading indicator that combines multiple market structure analysis tools to help traders identify price action shifts, liquidity targets, and potential trading opportunities across different timeframes.
HTF Candle Volume Thermometer is an advanced volume heatmap tool that visualizes higher timeframe volume distribution, helping traders identify key liquidity zones and price levels.
Volume Zones Internal Visualizer is an advanced candle type that reveals lower timeframe volume activity on a higher timeframe chart, highlighting volume zones and peak activity levels.
HTF Candle Insights helps traders analyze market trends across different timeframes by displaying higher timeframe candles directly on the current chart, enabling comprehensive market analysis.
An advanced trading signal that identifies Order Blocks and Fair Value Gaps to help traders recognize potential entry and exit points in market price movements.
A multi-timeframe candle visualization tool that allows flexible display of historical price data with pivot point calculations and customizable viewing options.
A comprehensive trading indicator that combines multiple market analysis techniques including liquidity sweeps, fair value gaps, market structure shifts, and trading sessions for precise market entry and exit points.
Likes, views, and comments are historical TradingView snapshots. They describe attention, not trading performance.