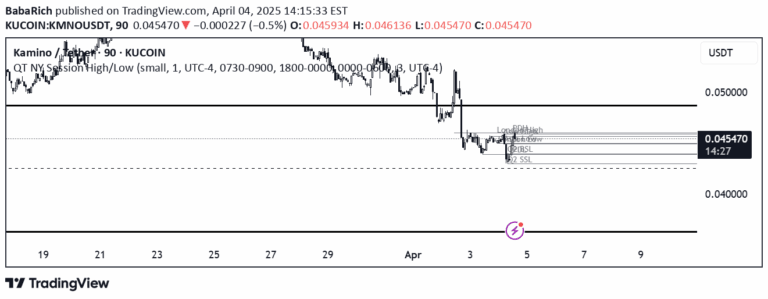
A multi-symbol scanner that tracks price movements against previous day, week, and month highs and lows, providing visual and alert-based tracking of key market levels.
Explore complementary indicator rolesHow it works
The indicator scans multiple user-defined symbols across different timeframes to identify when prices exceed their previous day, week, or month high and low levels. It uses a compact dashboard view with color-coded indicators: green checkmarks (✔) signify price exceeding the level, red crosses (❌) indicate price reversing after sweeping the level, and dashes (-) show levels not yet reached.
Users can customize the display to show numerical values of highs and lows instead of compact symbols. The indicator can also plot these levels directly on the chart, with levels initially appearing in black and changing to red once traded through, providing a dynamic visual representation of price movement relative to historical levels.
Why it may be useful
This multi-symbol scanner provides traders with a comprehensive overview of price movements across different timeframes and symbols, helping them quickly identify potential breakout or reversal opportunities. By tracking historical highs and lows, traders can gain insights into market momentum, support and resistance levels, and potential trend changes.
The flexible visualization options, including compact dashboard view and direct chart plotting, allow traders to quickly assess market conditions and make informed trading decisions. The ability to set alerts for level breaches enables traders to stay informed about significant price movements without constant chart monitoring.
When to explore it
The indicator is most effective for traders seeking to monitor multiple symbols simultaneously and track price movements against key historical levels. It is particularly useful during volatile market conditions where quick identification of breakouts or reversals can provide valuable trading opportunities.
Traders can benefit from this tool across various trading styles, including scalping, day trading, and swing trading. It is especially valuable for traders who want to maintain a broad market perspective, track potential trend changes, and receive timely alerts about significant price level breaches.
Keep exploring
What we’ve verified
Access, alerts and repainting behaviour have not been independently verified for this indicator. Check the creator’s current publication and settings.
General descriptions and classifications are recovered research. Verified details above identify the specific checks we have completed. Check the creator’s current publication for later changes.