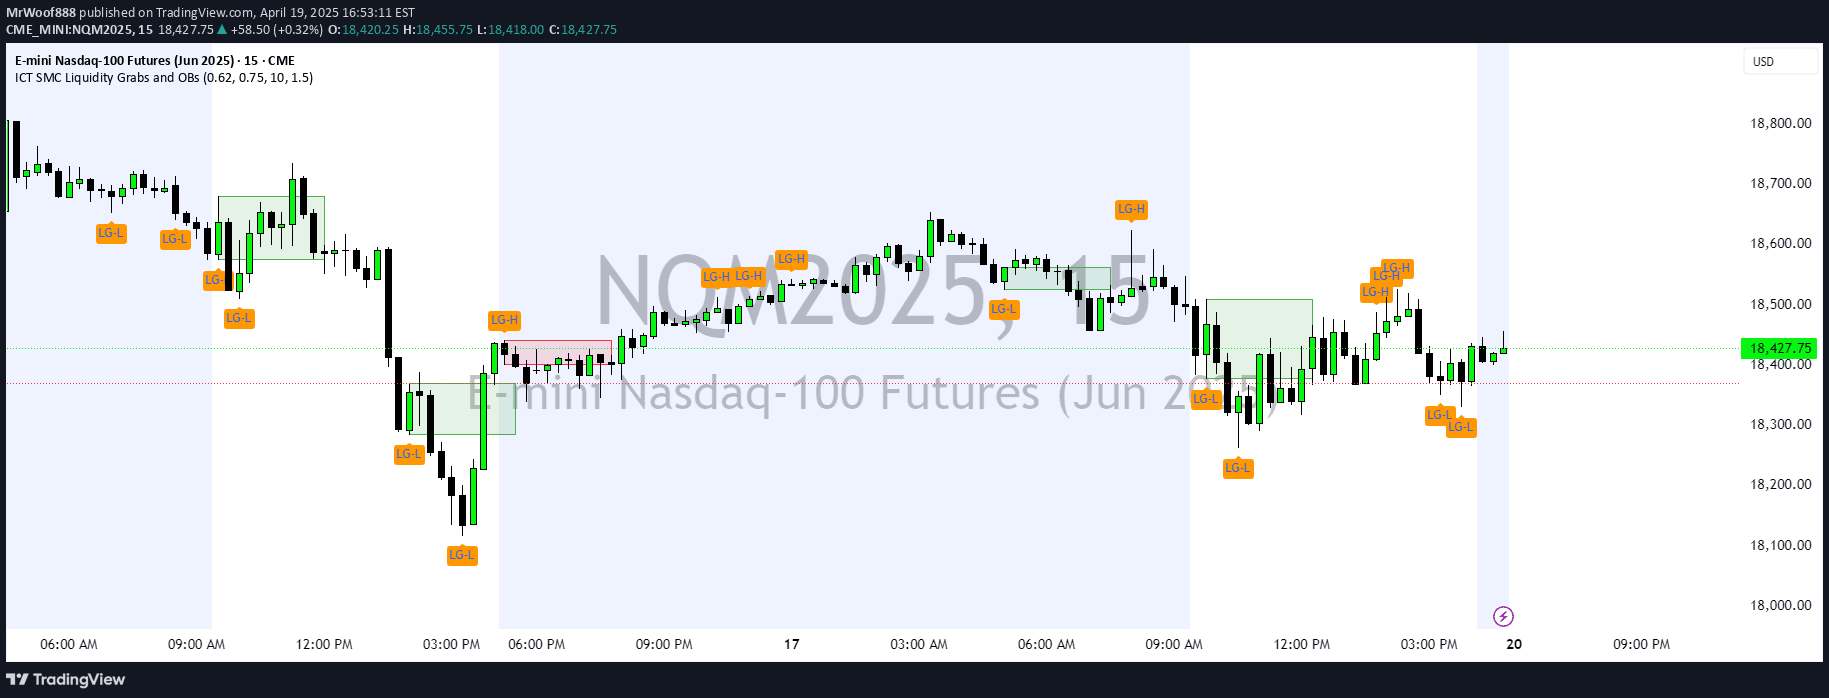
A trading indicator that identifies liquidity zones where stop losses accumulate, helping traders understand potential market reversals and institutional trading strategies.
Explore complementary indicator rolesHow it works
The liquidity pool indicator identifies areas on price charts where stop losses cluster, typically near support and resistance levels, swing highs and lows, and pattern formations. These zones represent potential points where institutional traders might trigger stop losses to create market movement.
The indicator uses sensitivity settings to detect both static and dynamic liquidity lines, allowing traders to customize the detection of these key areas. By analyzing price action around double tops, triple tops, trend lines, and other technical formations, the indicator helps traders visualize potential stop hunt zones.
Why it may be useful
Liquidity pool analysis provides insights into institutional trading strategies by revealing where large traders might intentionally trigger stop losses to create price movement. Understanding these zones helps traders anticipate potential market reversals and align their trading approach with smart money concepts.
By identifying areas of concentrated stop losses, traders can better manage risk, predict potential price manipulations, and make more informed trading decisions. This approach bridges the gap between retail and institutional trading perspectives, offering a more sophisticated view of market dynamics.
When to explore it
The liquidity pool indicator works best in markets with clear support and resistance levels, such as forex, stocks, and cryptocurrency trading. It is particularly effective in markets with high institutional participation and during periods of consolidation or range-bound trading.
Traders should use this indicator in conjunction with other technical analysis tools to confirm potential trading signals. It is most valuable when applied to timeframes that provide sufficient price action detail, such as 15-minute, 1-hour, and 4-hour charts.
Keep exploring
What we’ve verified
Access, alerts and repainting behaviour have not been independently verified for this indicator. Check the creator’s current publication and settings.
General descriptions and classifications are recovered research. Verified details above identify the specific checks we have completed. Check the creator’s current publication for later changes.