
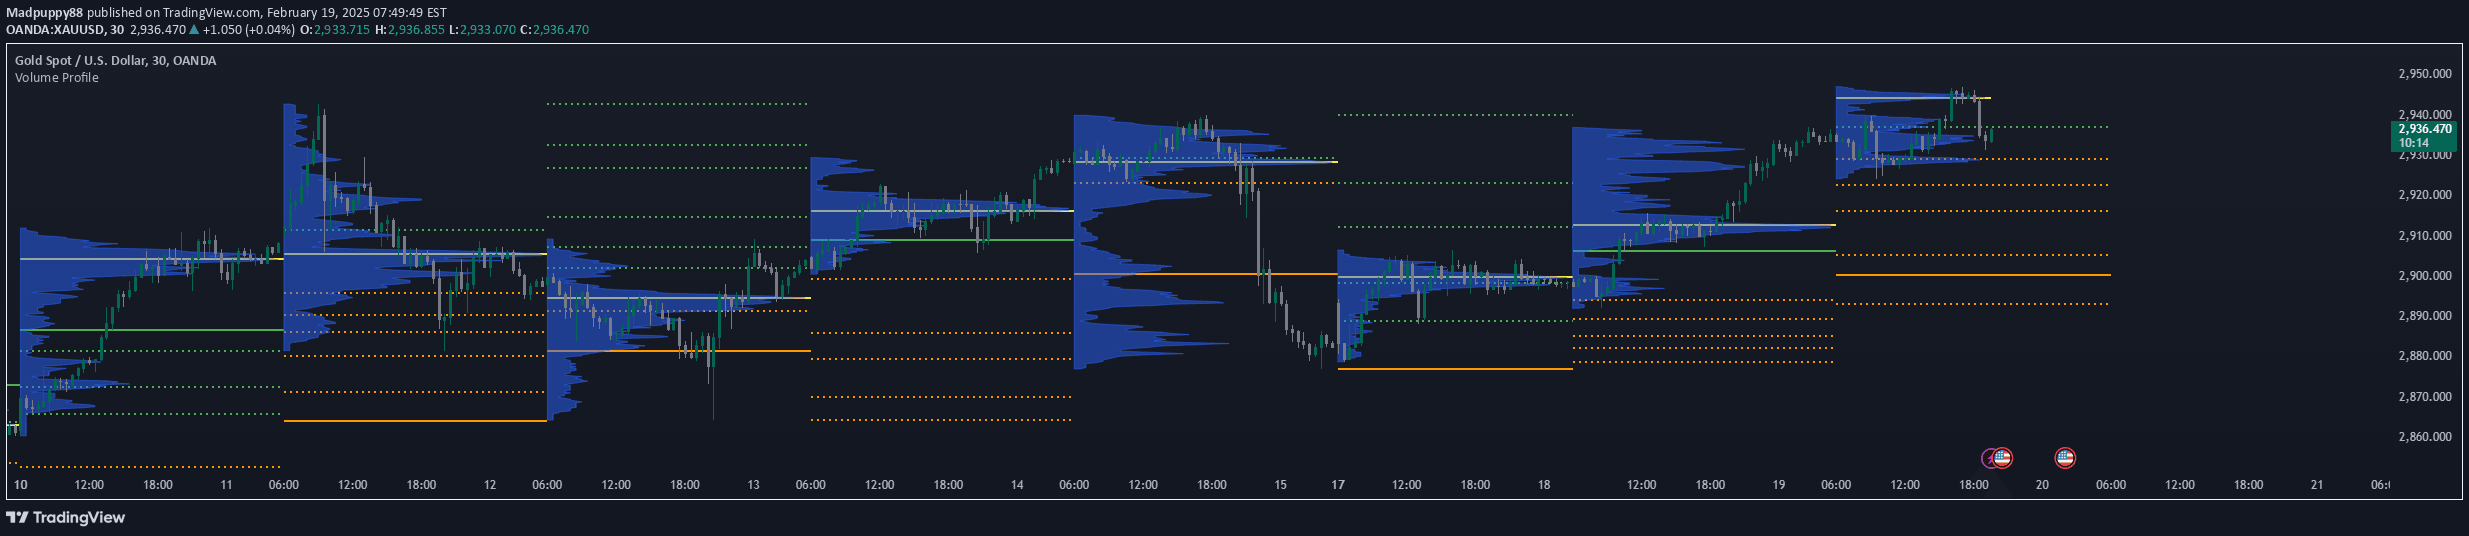
A volume-based technical analysis tool that visualizes trading volume across price levels, helping traders identify key support, resistance, and trading zones with precision.
Explore complementary indicator rolesHow it works
The Volume Profile Indicator analyzes trading volume distribution across different price levels within a specified timeframe. It creates a visual representation of volume intensity, highlighting the Volume Point of Control (VPOC), which represents the most traded price level during the selected period.
The indicator identifies High Volume Nodes (HVNs) and Low Volume Nodes (LVNs) by examining volume concentrations. HVNs show areas of significant trading activity, while LVNs reveal potential price rejection zones, providing traders with insights into market participation and price acceptance levels.
Why it may be useful
The Volume Profile Indicator offers traders a deeper understanding of market dynamics beyond traditional price charts by integrating volume analysis. It reveals where significant trading activity has occurred, helping traders identify potential support and resistance levels with greater accuracy and confidence.
By visualizing volume distribution, traders can make more informed decisions about market sentiment, potential breakout zones, and price acceptance levels. This approach provides a more comprehensive view of market behavior, enabling more strategic entry and exit points based on volume-driven insights.
When to explore it
The Volume Profile Indicator is most effective in markets with consistent trading volume and clear price structures. It works exceptionally well in liquid markets like major stock indices, forex pairs, and actively traded commodities where volume data provides meaningful insights.
Traders should utilize this indicator during periods of market consolidation, potential trend reversals, and when analyzing historical price action. It is particularly valuable when combined with other technical analysis tools to confirm trading signals and identify high-probability trading opportunities across different timeframes.
Keep exploring
What we’ve verified
Access, alerts and repainting behaviour have not been independently verified for this indicator. Check the creator’s current publication and settings.
General descriptions and classifications are recovered research. Verified details above identify the specific checks we have completed. Check the creator’s current publication for later changes.


