Targets For Many Indicators [LuxAlgo]
A versatile trading tool that generates price targets based on multiple technical indicators, helping traders set profit levels and manage risk dynamically.
Explore 11,183 indicators. Filter beyond the obvious.
Discover the tools that fit the way you trade.
11,183 tools to explore
A versatile trading tool that generates price targets based on multiple technical indicators, helping traders set profit levels and manage risk dynamically.
A comprehensive candlestick pattern indicator that detects market trends and aligns candlestick patterns with those trends, providing insights into potential market movements.
An advanced market structure indicator that identifies intrabar trend dynamics using Break of Structure (BoS) and Change of Character (CHoCH) patterns for real-time market analysis.
A higher timeframe indicator that identifies and visualizes fair value gaps in price movement, highlighting potential trading opportunities through color-coded background and candle representations.
A multi-symbol scanner that tracks price movements against previous day, week, and month highs and lows, providing visual and alert-based tracking of key market levels.
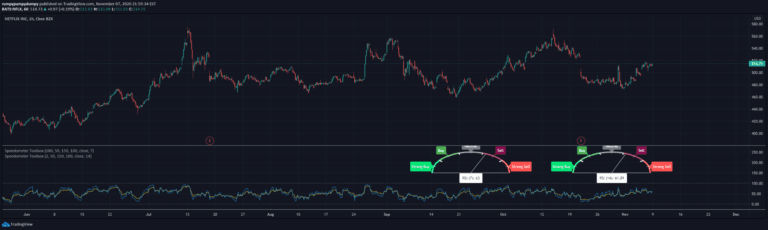
Custom metric speedometers provide specialized visualization techniques for tracking and representing performance indicators through graphical gauge-like representations.
A multi-level trend classification tool that detects market momentum using adaptive smoothing, color-coded candles, and dynamic trend bands to help traders identify trend strength and potential reversals.
A multi-ticker dashboard that visually tracks swing structures across different timeframes, helping traders identify potential trend formations and market confluence.
A spider chart visualization tool that combines multiple oscillators to provide a comprehensive view of market sentiment and trend dynamics using normalized indicators.
A multi-timeframe trend analysis tool that uses exponential moving averages (EMAs) to assess trend direction across five customizable timeframes, providing visual clarity on market momentum.
A dynamic moving average panel that reveals market sentiment by displaying the direction of multiple moving averages across different time periods, helping traders understand trend dynamics.
A trend-following indicator using three smoothed lines to analyze market changes across different timeframes, providing visual cloud color and dashboard insights for trend direction.
Likes, views, and comments are historical TradingView snapshots. They describe attention, not trading performance.