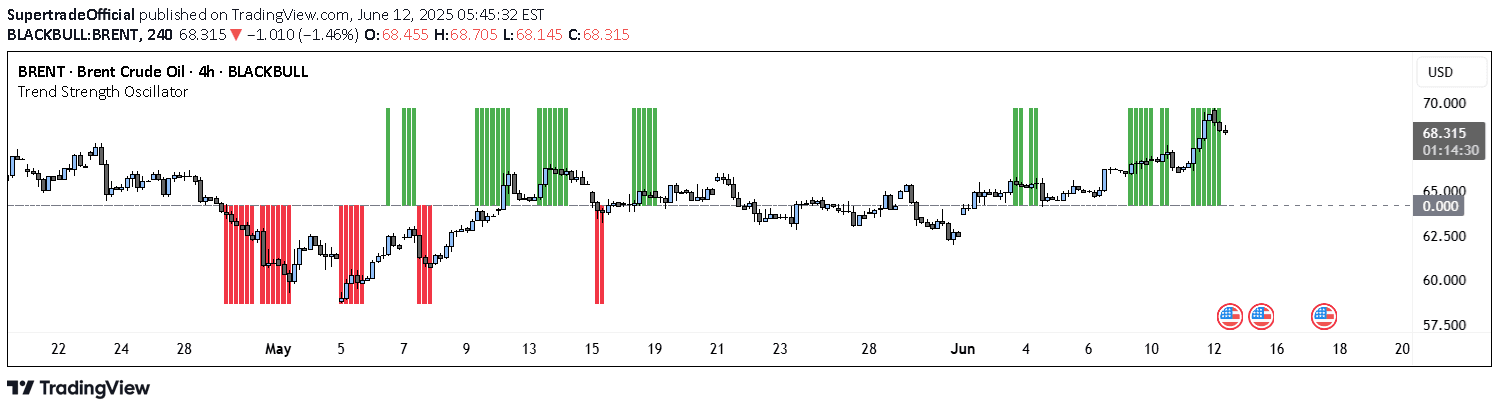
A multi-level trend classification tool that detects market momentum using adaptive smoothing, color-coded candles, and dynamic trend bands to help traders identify trend strength and potential reversals.
Explore complementary indicator rolesHow it works
The Trend Classifier uses an adaptive smoothing method to analyze price movements and classify trend conditions across multiple levels. It creates a central smoothed trend line and dynamically generates trend bands that automatically adjust visibility based on the current market direction.
The indicator classifies trend strength through three bullish and three bearish levels, with color-coded candles representing different market states. A trend strength dashboard in the top-right corner provides real-time bull and bear scores from 0 to 3, while trend change diamonds mark potential trend reversals.
Why it may be useful
Traders need clear, visual representations of market momentum to make informed trading decisions, and this tool provides a comprehensive view of trend dynamics. By breaking down market movements into quantifiable levels, the indicator helps traders understand the underlying strength and potential direction of price action.
The color-coded system and strength dashboard simplify complex market information, allowing traders to quickly assess whether a market is trending, consolidating, or potentially reversing. This approach reduces emotional decision-making and provides a structured framework for analyzing market conditions.
When to explore it
The Trend Classifier is most effective during periods of clear trending markets, where price is consistently moving in a specific direction with identifiable momentum. Traders can use the tool to confirm trend strength, identify potential entry and exit points, and gauge the reliability of current market conditions.
During ranging or consolidating markets, the indicator's neutral zones and 0-0 bull/bear score can help traders avoid false signals and wait for more definitive breakout confirmations. It works best when combined with volume indicators or oscillators to provide additional confirmation of trend strength and potential market shifts.
Keep exploring
What we’ve verified
Access, alerts and repainting behaviour have not been independently verified for this indicator. Check the creator’s current publication and settings.
General descriptions and classifications are recovered research. Verified details above identify the specific checks we have completed. Check the creator’s current publication for later changes.