Liquidity Swings [LuxAlgo]
A liquidity indicator that highlights swing areas with trading activity, tracking price revisits, accumulated volume, and potential support/resistance zones using customizable filtering.
Explore 11,183 indicators. Filter beyond the obvious.
Discover the tools that fit the way you trade.
11,183 tools to explore
A liquidity indicator that highlights swing areas with trading activity, tracking price revisits, accumulated volume, and potential support/resistance zones using customizable filtering.
Elliott Wave indicator automatically detects impulse and corrective wave patterns in price movements, helping traders identify potential trend directions and market phases.
A range-based indicator that highlights price ranges to help identify potential breakouts and trading opportunities by visually marking key price levels and market movements.
A trading indicator that calculates average Fair Value Gap (FVG) initiation levels to identify potential support and resistance zones based on significant market participant positioning.
A trading system for identifying potential trend reversals using setup and count methods with support and resistance levels for strategic market entry and exit points.
A trading indicator that highlights previous market highs and lows, creating customizable support and resistance zones across multiple timeframes to help traders identify potential price reaction levels.
A volume-based trading tool that identifies market imbalances by analyzing premium and discount zones, calculating delta volume to reveal potential price reversals and trend strength.
The Relative Trend Index (RTI) is an advanced technical indicator that measures trend strength by analyzing price positioning within its recent range, offering more adaptive insights than traditional momentum tools.
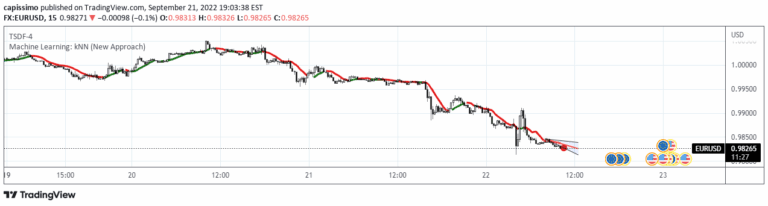
KNN is a machine learning technique predicting next price bar using nearest neighbor data points, providing trend insights by analyzing historical price sequences.
A multi-level trend classification tool that detects market momentum using adaptive smoothing, color-coded candles, and dynamic trend bands to help traders identify trend strength and potential reversals.
An advanced Smart Money Concept indicator that identifies swing high and low zones, helping traders determine premium and discount areas for optimal trade positioning and market structure analysis.
A volume profile indicator that automatically calculates point of control (POC) for different time periods, identifying significant price levels and market structure across various trading timeframes.
Likes, views, and comments are historical TradingView snapshots. They describe attention, not trading performance.