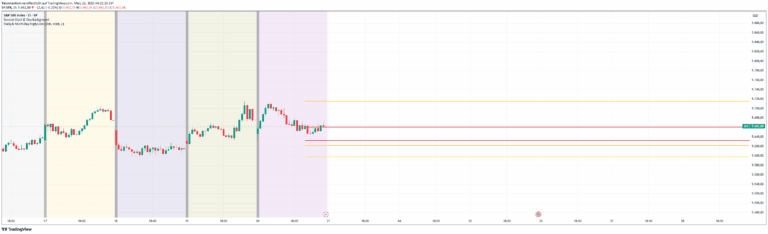
A trading indicator that highlights previous market highs and lows, creating customizable support and resistance zones across multiple timeframes to help traders identify potential price reaction levels.
Explore complementary indicator rolesHow it works
The Previous Highs & Lows indicator identifies and plots maximum and minimum price points from selected time intervals such as hourly, daily, weekly, monthly, and yearly. By tracking these historical price extremes, the indicator creates numbered levels that represent potential support and resistance zones, with more recent levels given priority and enhanced visibility.
Users can customize the number of previous highs and lows displayed, control the area width, and filter levels based on their current price position. The indicator also introduces two additional areas constructed from percentiles of the returned previous highs and lows, providing broader support and resistance zones that can help traders anticipate potential price reactions.
Why it may be useful
Previous price highs and lows are critical reference points that often trigger market reactions, as traders and algorithms tend to remember and respect these historical price levels. By systematically mapping these key levels, traders can gain insights into potential support and resistance zones, helping them make more informed entry, exit, and risk management decisions.
The indicator's ability to adapt to different timeframes and provide customizable visualization makes it a versatile tool for understanding market structure. The graduated transparency and filtering options allow traders to focus on the most relevant and recent price levels, reducing visual clutter and improving strategic decision-making.
When to explore it
The Previous Highs & Lows indicator is most effective in markets with clear historical price patterns and when trading instruments that demonstrate consistent level-based reactions. It works particularly well in trending markets where price tends to respect previous support and resistance zones, making it valuable for traders seeking to identify potential reversal or continuation points.
Traders should be cautious when using this indicator on highly volatile or news-driven markets where historical levels might be less reliable. It is most powerful when combined with other technical analysis tools and used across multiple timeframes to confirm potential trading signals and improve overall market analysis.
Keep exploring
What we’ve verified
Access, alerts and repainting behaviour have not been independently verified for this indicator. Check the creator’s current publication and settings.
General descriptions and classifications are recovered research. Verified details above identify the specific checks we have completed. Check the creator’s current publication for later changes.