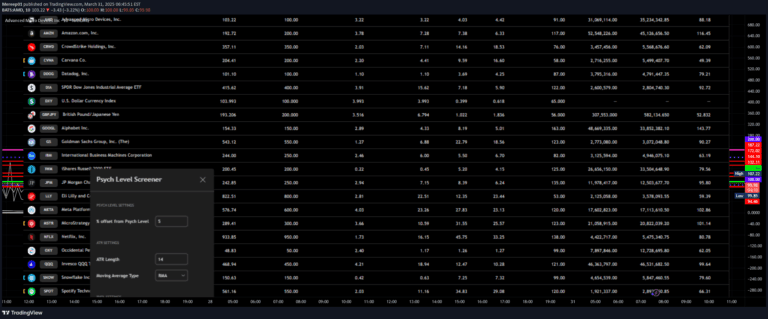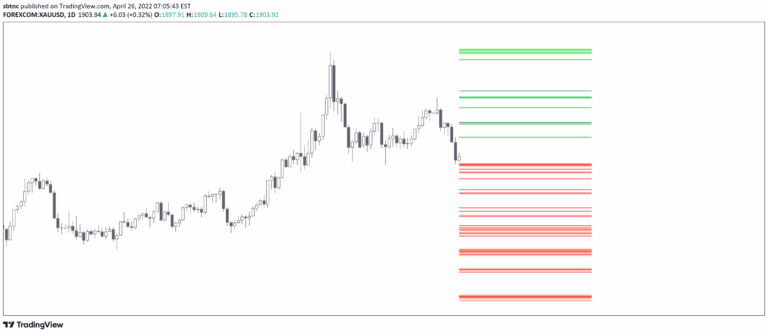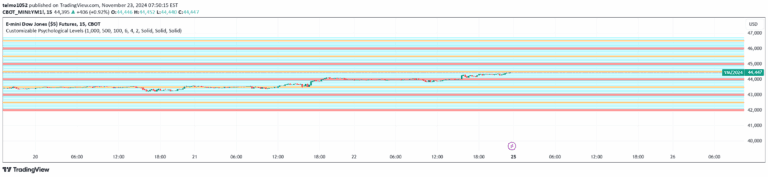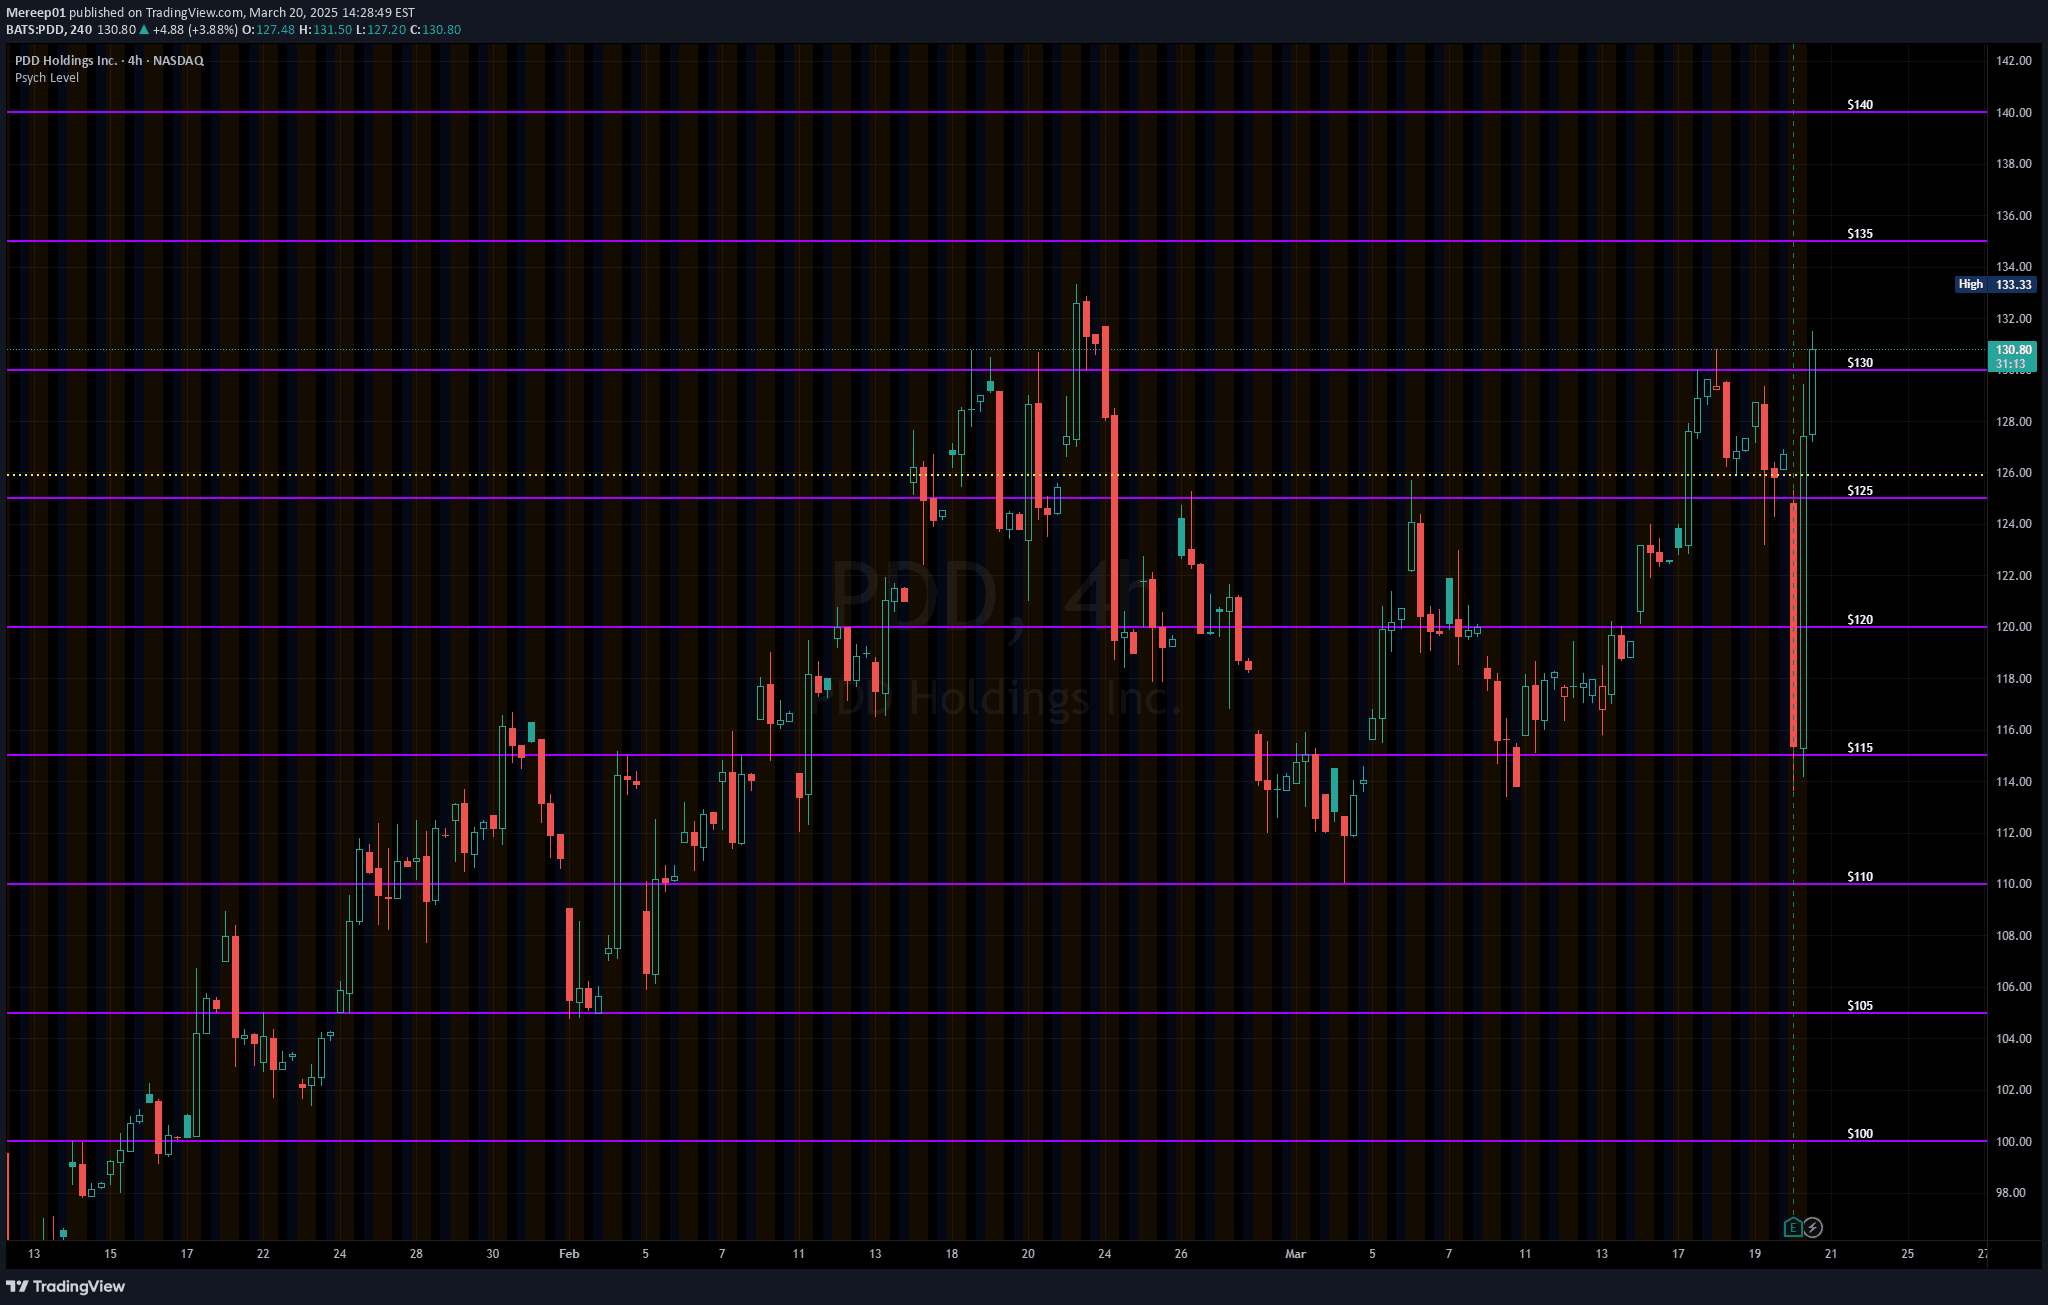
A trading indicator that automatically draws psychological price levels as support and resistance lines, helping traders identify potential entry, exit, and risk management points.
Explore complementary indicator rolesHow it works
The psychological levels indicator automatically draws horizontal lines at round number price levels within a user-defined range. Traders can set minimum and maximum values and specify an interval for line placement.
The indicator considers round numbers like 10, 50, 100, and 1000 as potential significant price points. Users can customize line color, width, style, and label settings. The lines are generated based on the specified parameters, creating a visual representation of potential support and resistance levels
Why it may be useful
Psychological price levels are crucial because traders often place limit orders at round numbers, creating natural support and resistance zones. These levels can reveal potential market sentiment and trading activity.
By automatically identifying and visualizing these levels, traders can make more informed decisions about entry and exit points. The indicator helps quickly map out important price regions without manual calculation, saving time and providing a systematic approach to identifying potential trading opportunities
When to explore it
This indicator works best in markets with clear psychological pricing levels, such as stocks, forex, and cryptocurrencies. It is most effective during ranging or trending markets where price tends to respect round number levels.
Traders should use it in conjunction with other technical analysis tools for confirmation. It is particularly useful for swing traders and day traders looking to identify potential support and resistance zones. The indicator can help in setting stop-loss, take-profit, and entry point strategies
Keep exploring
What we’ve verified
Access, alerts and repainting behaviour have not been independently verified for this indicator. Check the creator’s current publication and settings.
General descriptions and classifications are recovered research. Verified details above identify the specific checks we have completed. Check the creator’s current publication for later changes.