Intraday Levels
A day trading indicator that tracks and displays key price levels throughout the trading session, helping traders identify potential support and resistance zones.
Explore 11,183 indicators. Filter beyond the obvious.
Discover the tools that fit the way you trade.
11,183 tools to explore
A day trading indicator that tracks and displays key price levels throughout the trading session, helping traders identify potential support and resistance zones.
A multi-timeframe EMA indicator that displays horizontal lines at specific price levels across 30-minute, 1-hour, and 4-hour charts to identify potential support and resistance zones.
Fibonacci retracement tool that automatically draws support and resistance levels on charts, helping traders identify potential price reversal points during trading sessions.
A trading indicator that automatically draws psychological price levels as support and resistance lines, helping traders identify potential entry, exit, and risk management points.
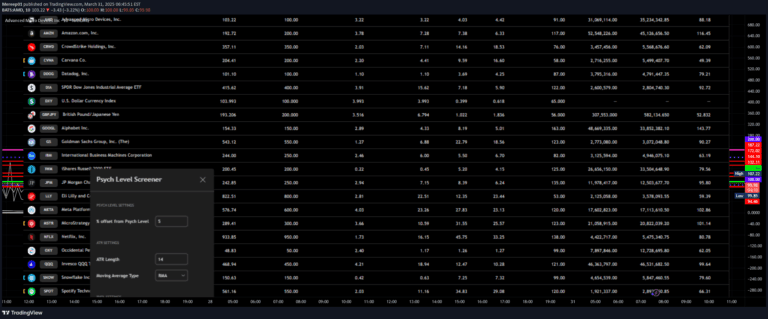
A Pine Screener tool that identifies stocks near psychological price levels, helping traders discover potential trading opportunities by scanning watchlists within a specified percentage offset.
Likes, views, and comments are historical TradingView snapshots. They describe attention, not trading performance.