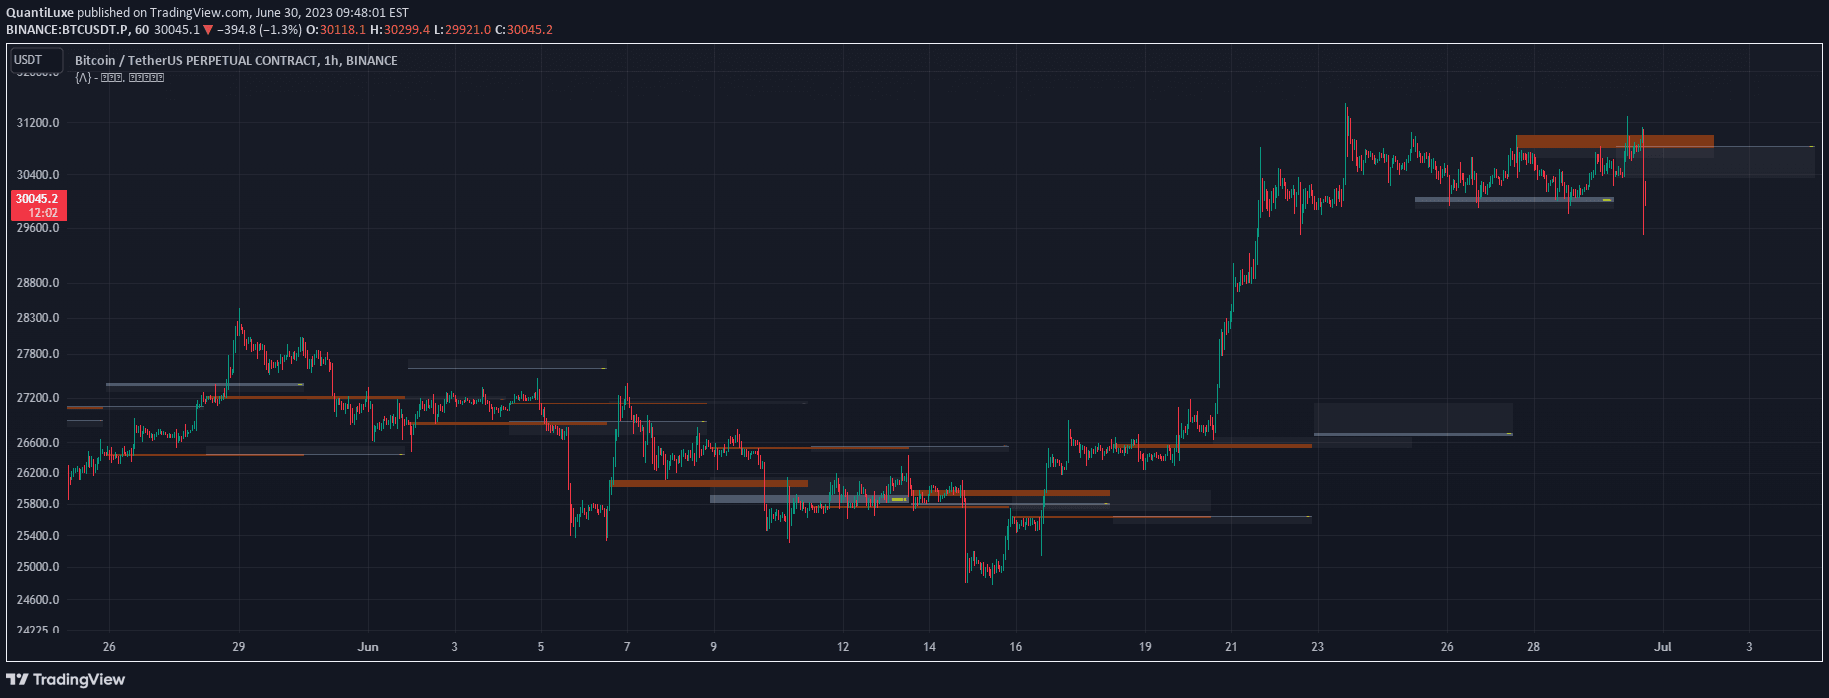
A trading indicator that identifies untapped liquidity levels across different timeframes, helping traders understand potential price movement magnets and liquidity pools in the market.
Explore complementary indicator rolesHow it works
The indicator tracks previous days, weeks, and months' high and low levels, focusing on identifying untapped liquidity zones. It analyzes potential areas where stop-loss orders and resting market orders accumulate, particularly at significant swing points and higher timeframe extremes.
The system marks these levels as potential liquidity pools that could attract price movement. Each identified level is monitored for potential interaction, with tapped levels being highlighted during the trading session. At the end of each day, all tapped levels are cleared, preparing the indicator for the next trading period
Why it may be useful
Understanding liquidity pools is crucial for traders seeking to anticipate potential market movements. This indicator provides insights into hidden market dynamics by revealing areas where significant order concentrations exist.
Traders can use these insights to predict potential price targets, understand market structure, and develop more strategic entry and exit points. By highlighting untapped levels, the indicator helps traders identify potential price magnets and understand the underlying market psychology. It transforms abstract market concepts into actionable trading information
When to explore it
The indicator works best in markets with clear trend structures and consistent liquidity patterns. It is most effective during periods of moderate to high trading volume, where order clusters are more likely to form. Traders should use this tool when analyzing markets with sufficient historical price data and well-defined swing points.
It is particularly useful for day traders and swing traders looking to understand potential market turning points. The indicator can be applied across various financial instruments, including stocks, forex, cryptocurrencies, and futures markets
Keep exploring
What we’ve verified
Access, alerts and repainting behaviour have not been independently verified for this indicator. Check the creator’s current publication and settings.
General descriptions and classifications are recovered research. Verified details above identify the specific checks we have completed. Check the creator’s current publication for later changes.