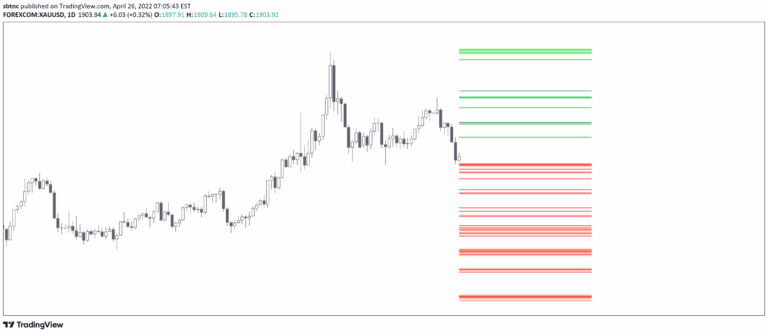
A multi-functional trading indicator that visualizes high timeframe liquidity levels, identifies market structure breaks, and highlights price displacements for advanced trading strategies.
Explore complementary indicator rolesHow it works
The indicator operates through three primary functions: high timeframe (HTF) liquidity visualization, candlestick displacement detection, and market structure break (MSB) line display. It identifies and plots liquidity pools across multiple timeframes including monthly, weekly, daily, H1, and H4 charts, with each timeframe showing the three most recent liquidity lines.
When price reaches a liquidity line, the line is automatically repainted, with the previous line remaining as a 'purged' line that can be optionally hidden. The displacement feature changes candlestick colors based on significant price movements, and can be configured to highlight Fair Value Gaps (FVG), making it particularly useful for ICT-style trading approaches.
Why it may be useful
This indicator provides traders with advanced insights into market dynamics by revealing hidden liquidity pools where stop losses are concentrated. By visualizing these levels, traders can anticipate potential stop hunting scenarios and understand institutional trading behavior more deeply.
The multi-functional design allows traders to simultaneously track market structure breaks, identify displacement patterns, and monitor liquidity across different timeframes. This comprehensive approach helps traders make more informed decisions by providing a holistic view of market mechanics beyond traditional price action analysis.
When to explore it
The indicator is most effective in markets with clear institutional activity and pronounced liquidity pools, such as forex, futures, and major cryptocurrency pairs. It works best when traders want to understand underlying market mechanics and potential institutional trading intentions.
Traders should use this tool when seeking to identify potential reversal zones, stop hunting scenarios, and significant market structure changes. It is particularly valuable for traders employing ICT (Inner Circle Trader) methodologies or those interested in understanding the nuanced movements of professional market participants.
Keep exploring
What we’ve verified
Access, alerts and repainting behaviour have not been independently verified for this indicator. Check the creator’s current publication and settings.
General descriptions and classifications are recovered research. Verified details above identify the specific checks we have completed. Check the creator’s current publication for later changes.