Liquidity Price Depth Chart [LuxAlgo]
A depth chart visualizing price liquidity by mapping bullish and bearish price variations, highlighting volume clusters and potential support/resistance zones across trading ranges.
Explore 11,183 indicators. Filter beyond the obvious.
Discover the tools that fit the way you trade.
11,183 tools to explore
A depth chart visualizing price liquidity by mapping bullish and bearish price variations, highlighting volume clusters and potential support/resistance zones across trading ranges.
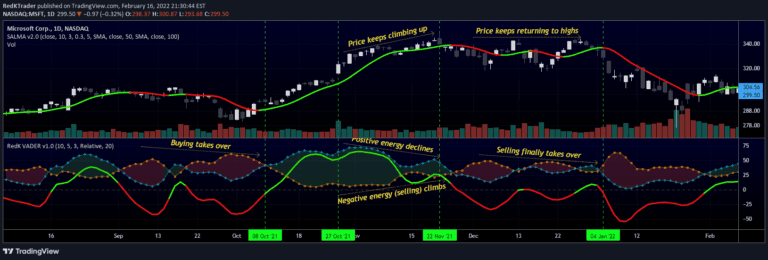
VADER is a volume-based technical indicator that measures market energy by analyzing price displacement and trading volume to determine bullish or bearish market sentiment.
An indicator that identifies Fair Value Gaps and tracks price interactions, highlighting potential support and resistance zones based on price action and market energy.
A multi-timeframe Fair Value Gap (FVG) indicator that identifies potential price reaction zones by analyzing overlapping price gaps across different chart periods.
Advanced trading strategy focusing on liquidity and price imbalances, utilizing Fair Value Gaps and Market Structure Shifts to identify optimal trade entry points across different market conditions.
A trading signal that identifies market imbalances through Fair Value Gaps (FVG) across multiple timeframes, revealing potential trading opportunities based on price inefficiencies.
A multi-functional trading indicator that visualizes high timeframe liquidity levels, identifies market structure breaks, and highlights price displacements for advanced trading strategies.
A price action trading signal that identifies three-bar price gaps using UDT in PineScript, focusing on analyzing price movement and time perception for potential market direction.
A dynamic RSI event tracking tool that measures market impact through heat maps, analyzing price displacement after specific RSI crossover or crossunder events.
A trading indicator that identifies market inefficiencies by detecting simultaneous Fair Value Gaps, alerting traders to potential large player involvement and price imbalances.
An indicator analyzing liquidity engulfing candles across multiple timeframes, revealing potential market structure breaks and displacement opportunities using ICT trading principles.
The Adaptive Cloud Oscillator is an advanced technical analysis tool that dynamically detects market trends, provides support and resistance levels, and offers adaptive insights for trading decisions.
Likes, views, and comments are historical TradingView snapshots. They describe attention, not trading performance.