
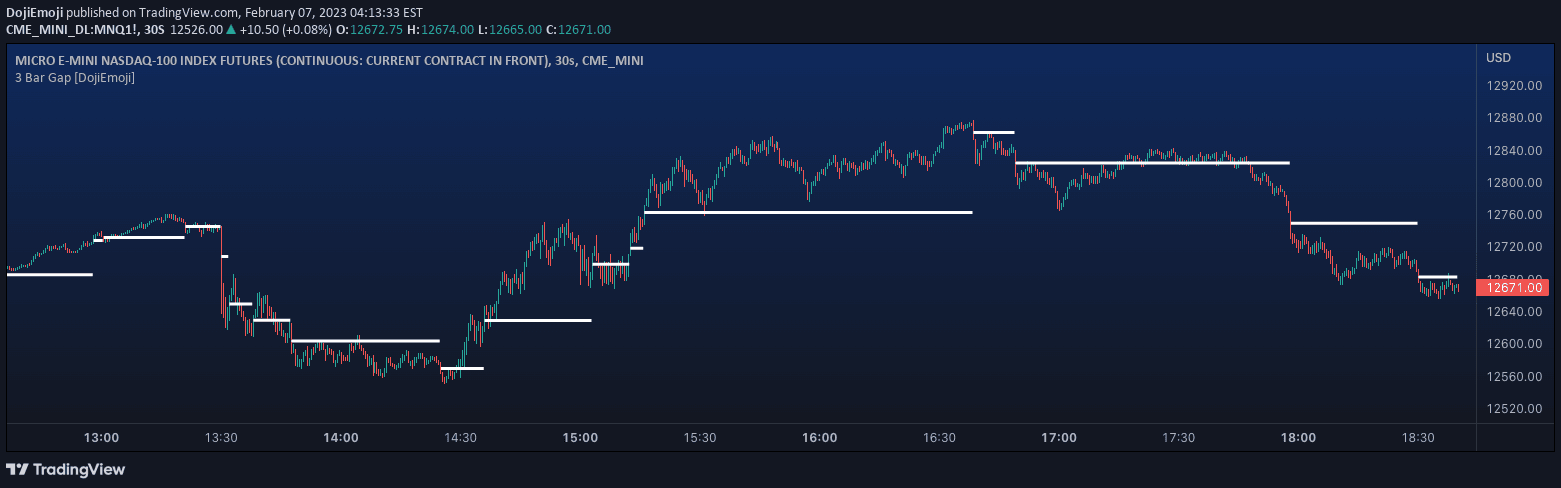
A price action trading signal that identifies three-bar price gaps using UDT in PineScript, focusing on analyzing price movement and time perception for potential market direction.
Explore complementary indicator rolesHow it works
The signal analyzes price movement across three consecutive bars by calculating the displacement of highs and lows. It identifies downward moves when the recent confirmed bar's high is lower than the previous bar's low, and upward moves when the recent bar's low is higher than the previous bar's high.
An ATR (Average True Range) filter is applied to reduce noise and filter out minor price changes. The ATR is calculated using a specified lookback period and multiplier, which helps determine a meaningful threshold for price gaps.
Why it may be useful
This signal provides traders with a raw, clean approach to analyzing price action without relying on complex indicators or fundamental analysis. By focusing solely on price movement and time perception, traders can gain insights into potential market directions and momentum.
The method offers flexibility for different trading styles, allowing trend followers to enter trades in the gap's direction and contrarians to identify potential support and resistance levels. Its simplicity makes it accessible to both experienced and developing traders seeking a straightforward market analysis tool.
When to explore it
The signal works best in markets with clear, decisive price movements and during periods of heightened volatility. It is particularly effective for traders who prefer a minimalist approach to chart analysis and want to quickly identify potential trading opportunities.
Traders should apply this signal in conjunction with other technical analysis tools and consider the specific characteristics of the traded asset. It is most suitable for active trading styles like scalping and day trading, where quick identification of price gaps can provide a competitive edge.
Keep exploring
What we’ve verified
Access, alerts and repainting behaviour have not been independently verified for this indicator. Check the creator’s current publication and settings.
General descriptions and classifications are recovered research. Verified details above identify the specific checks we have completed. Check the creator’s current publication for later changes.


