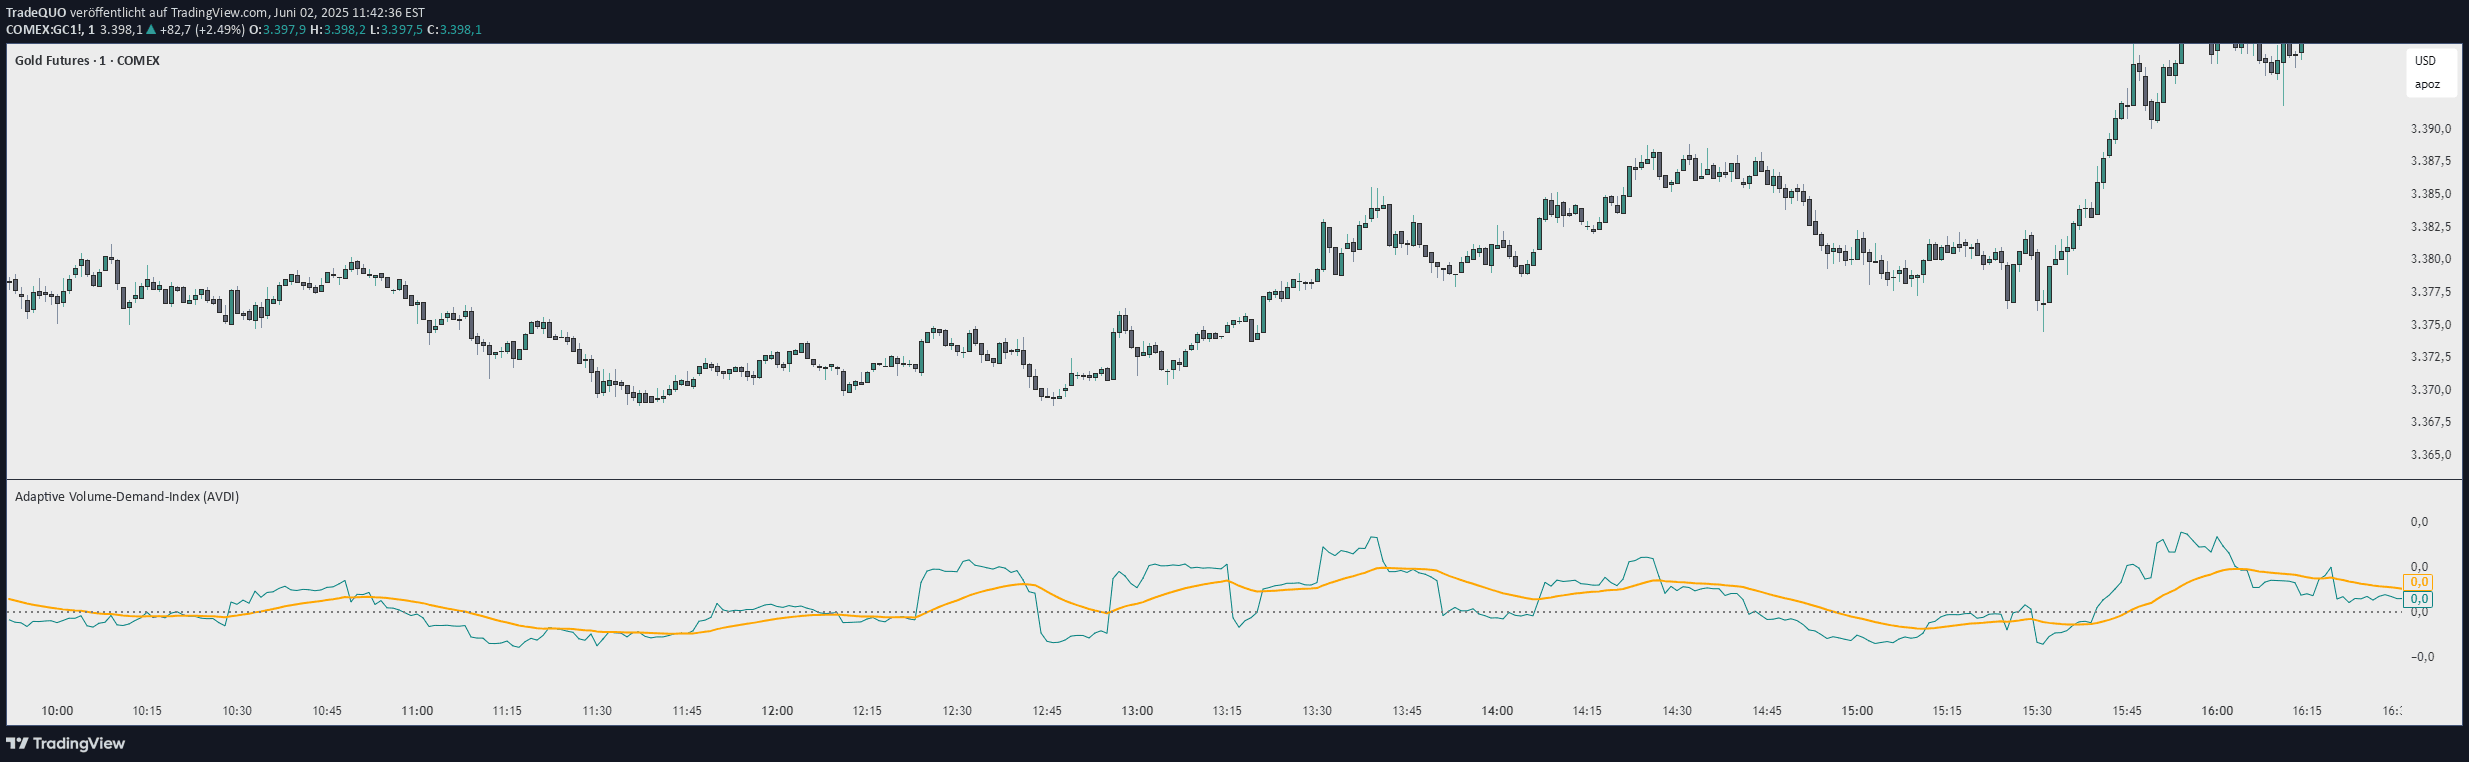
An advanced volume delta analysis tool that identifies market imbalances by combining volume profile, price dynamics, and multi-component scoring to detect potential trend reversals and market strength.
Explore complementary indicator rolesHow it works
The Volume Delta Imbalance Index (VDII) processes market data through four primary components: volume profile analysis, flow imbalance detection, strength analysis, and final score calculation. It creates dynamic volume delta distribution profiles by weighing recent and historical data to identify significant price levels and market bias.
The indicator calculates normalized flow ratios, analyzes buying versus selling pressure, and incorporates volume-weighted movements to determine market strength. By combining these components with weighted importance and applying volatility-based smoothing, the VDII generates a comprehensive signal output that provides insights into potential market dynamics.
Why it may be useful
The VDII offers traders a sophisticated analytical tool that goes beyond traditional price-based indicators by providing a multi-dimensional view of market conditions. Its ability to integrate volume profile analysis with price movement dynamics allows traders to gain deeper insights into market sentiment, potential reversals, and trend continuation scenarios.
By combining multiple volume metrics and using an adaptive calculation system, the indicator helps traders understand market strength, flow imbalances, and potential turning points with greater precision. This comprehensive approach enables more informed trading decisions by offering a nuanced perspective on market dynamics that traditional indicators might miss.
When to explore it
The Volume Delta Imbalance Index is most effective in liquid markets with consistent volume and clear trending or ranging conditions. Traders should look for established trends where the VDII returns towards zero and volume bars become less intense, signaling potential continuation or reversal points.
Ideal usage includes monitoring small retracements above the zero line and observing volume bar color changes as confirmatory signals. The indicator works best when traders can leverage its multi-component analysis to identify significant market imbalances and potential trading opportunities across different timeframes.
Keep exploring
What we’ve verified
Access, alerts and repainting behaviour have not been independently verified for this indicator. Check the creator’s current publication and settings.
General descriptions and classifications are recovered research. Verified details above identify the specific checks we have completed. Check the creator’s current publication for later changes.