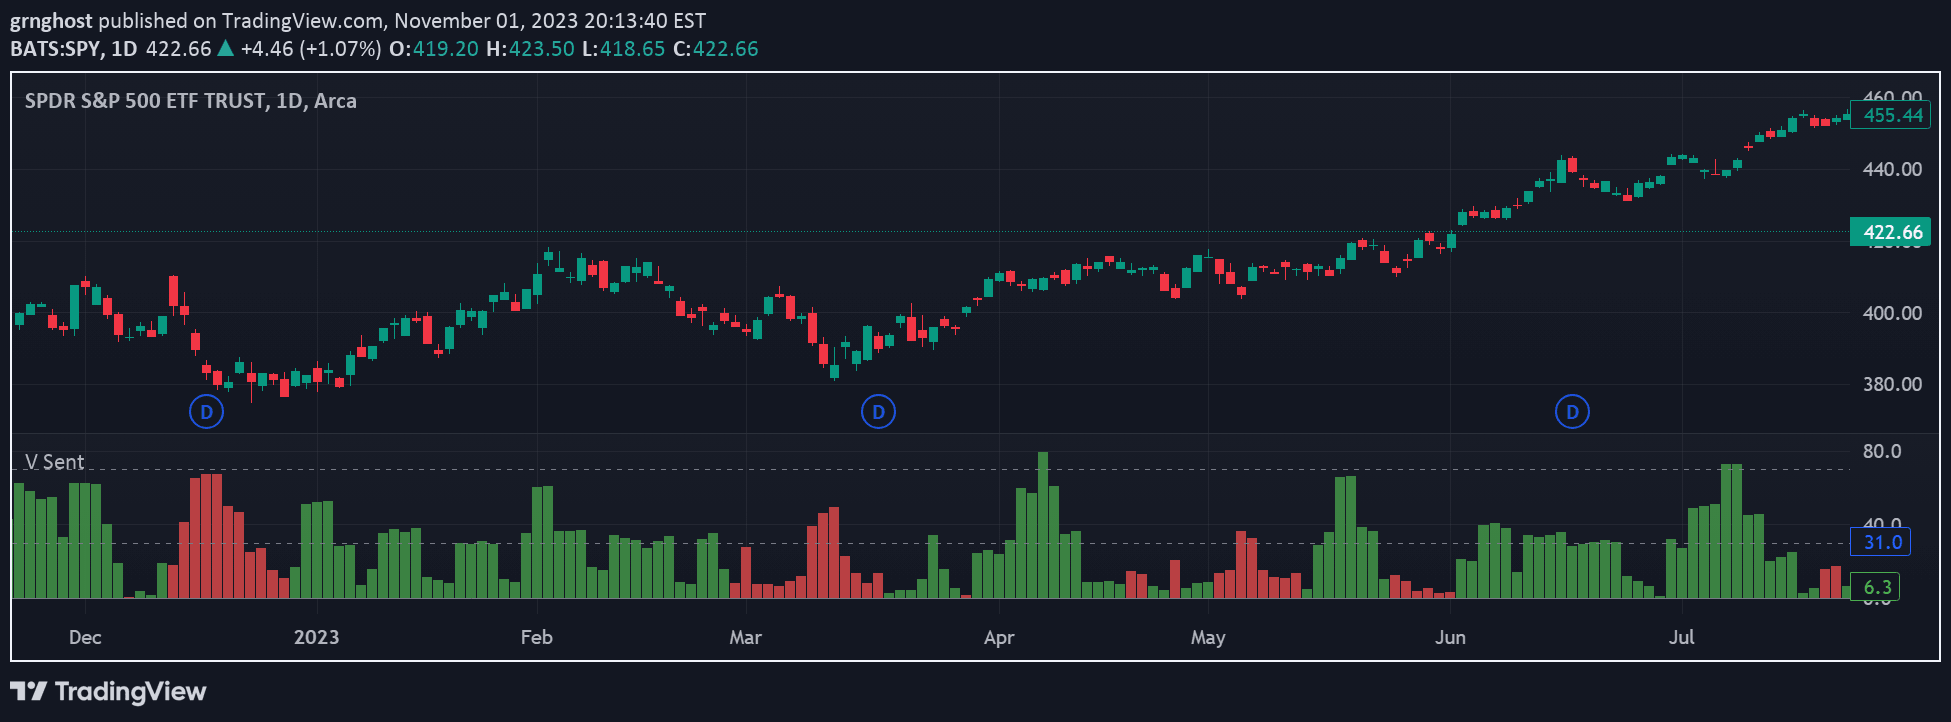
A volume analysis tool that measures trading volume relative to historical averages, distinguishing between bullish and bearish volume flows to provide insights into market participation.
Explore complementary indicator rolesHow it works
The Relative Directional Volume Indicator calculates relative volume by dividing current bar volume by the average volume over a specified lookback period. It categorizes volume as bullish or bearish based on price action, with bullish volume occurring when price closes above its open, and bearish volume when price closes below or at its open.
The indicator then applies a moving average to smooth the data, creating color-coded histogram bars that represent volume magnitude. These bars are color-coded to show the directional flow, with green representing bullish volume and red representing bearish volume, allowing traders to quickly visualize volume dynamics.
Why it may be useful
This indicator provides critical insights into market participation and trend strength by revealing whether current trading volume is above or below average. By distinguishing between bullish and bearish volume flows, traders can gain a deeper understanding of the underlying market sentiment and potential price movements.
The ability to detect unusual volume activity helps traders identify potential trend confirmations, reversals, or exhaustion points. It offers a more nuanced view of market dynamics than traditional volume indicators, allowing traders to assess not just the quantity of trading volume, but also its directional implications.
When to explore it
The Relative Directional Volume Indicator is most effective when used in conjunction with price action analysis and other technical indicators. It works particularly well during key market events, breakouts, and potential trend change scenarios where volume can provide critical confirmation.
Traders should pay special attention to volume spikes, divergences between price and volume, and shifts in the relationship between bullish and bearish moving averages. It is especially valuable for identifying institutional participation, analyzing market participation during consolidation phases, and providing additional context to price movements across multiple timeframes.
Keep exploring
What we’ve verified
Access, alerts and repainting behaviour have not been independently verified for this indicator. Check the creator’s current publication and settings.
General descriptions and classifications are recovered research. Verified details above identify the specific checks we have completed. Check the creator’s current publication for later changes.