YOUR INDICATOR RESEARCH STARTS HERE

Find the right indicator.
Understand what it does.

Explore 11,183 indicators. Filter beyond the obvious.
Discover the tools that fit the way you trade.

THE INDICATOR LIBRARY

Results for “sentiment”

11,183 tools to explore

2,052 indicators matching your filters
Save search
VolumeEditor’s pick

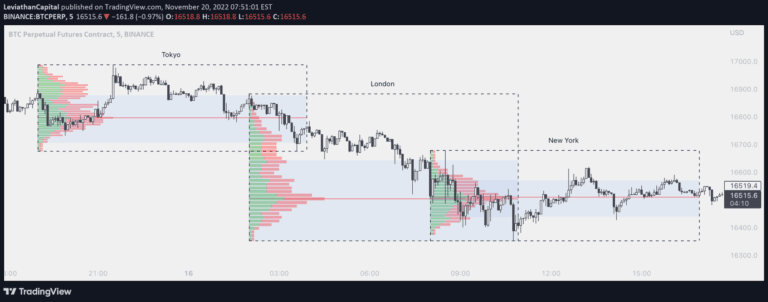
Volume Profile / Fixed Range

by LonesomeTheBlue

A Volume Profile indicator that calculates trading volumes within a fixed range, helping traders understand volume distribution and identifying key price levels with visual representation.

Main price chart · unverifiedDay Trading · Swing Trading
Explore
13.4Klikes576.6Kviews171comments
Save
LevelsSignalVolume

Money Flow Profile [LuxAlgo]

by LuxAlgo

A charting tool that measures traded volume and money flow across price levels, revealing trading activity, sentiment, and key market levels for strategic analysis.

Main price chart · unverifiedScalping · Day Trading
Explore
9.6Klikes216.8Kviews43comments
Save
VolumeTrendEditor’s pick

Mxwll Price Action Suite [Mxwll]

by MXWLL-Capital-Trading

Advanced trading indicator providing comprehensive market structure analysis with customizable sensitivities, identifying price action patterns, order blocks, and session dynamics for strategic trading decisions.

Main price chart · unverifiedDay Trading · Swing Trading
Explore
9.4Klikes248.9Kviews177comments
Save
VolumeSignal

Volume Delta Candles [LuxAlgo]

by LuxAlgo

Volume Delta Candles analyze intrabar trading activity by comparing buy and sell volumes, providing visual insights into price movement and trading sentiment within each candle.

Main price chart · unverifiedScalping · Day Trading
Explore
8.8Klikes229.5Kviews53comments
Save
PatternsSignalTrend

Three Bar Reversal Pattern [LuxAlgo]

by LuxAlgo

A technical analysis indicator that identifies three-bar reversal patterns, helping traders detect potential trend changes by analyzing consecutive price bar formations and their relationships.

Main price chart · unverifiedScalping · Day Trading
Explore
7.7Klikes90.2Kviews19comments
Save
VolumeEditor’s pick

Tick Chart

by LonesomeTheBlue

Tick Chart is a unique charting method that creates candlesticks based on a specific number of price ticks, offering an alternative to time-based charts for analyzing market movements.

Main price chart · unverifiedScalping · Day Trading
Explore
7.5Klikes149.3Kviews105comments
Save

Likes, views, and comments are historical TradingView snapshots. They describe attention, not trading performance.

START WITH A QUESTION

A little less searching.
A lot more understanding.

Tell DeepAlpha what you need. Get an explanation, a shortlist,
and a direct path to the indicators behind it.

Ask DeepAlpha