Mxwll Price Action Suite [Mxwll]
Advanced trading indicator providing comprehensive market structure analysis with customizable sensitivities, identifying price action patterns, order blocks, and session dynamics for strategic trading decisions.
Explore 11,183 indicators. Filter beyond the obvious.
Discover the tools that fit the way you trade.
11,183 tools to explore
Advanced trading indicator providing comprehensive market structure analysis with customizable sensitivities, identifying price action patterns, order blocks, and session dynamics for strategic trading decisions.
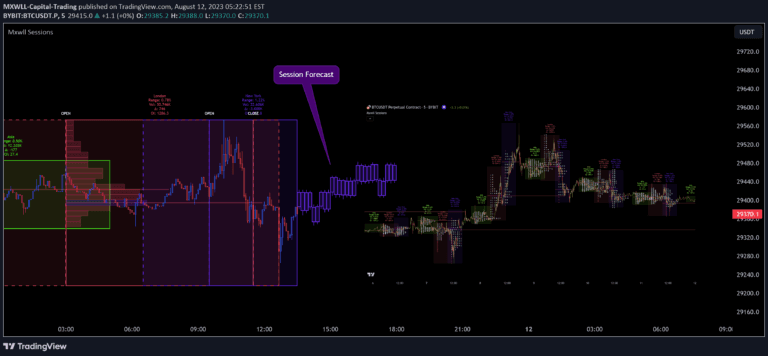
A comprehensive market session indicator that displays TPO profiles, market session times, volume delta, and price forecasts across different trading periods with advanced statistical analysis.
A multi-timeframe support and resistance indicator that helps traders identify key price levels across different timeframes for more comprehensive market analysis.
A trading indicator that calculates cumulative volume delta across price trends, providing insights into trend strength and potential price movement reversals using a customizable zig-zag approach.
A comprehensive liquidation delta indicator tracking cryptocurrency market liquidations across multiple exchanges, providing detailed insights into long and short trading dynamics.
A comprehensive trading tool that helps traders assess liquidation risk, calculate position sizing, and determine optimal leverage and profit targets for both long and short positions.
A sophisticated trading indicator that finds historically similar price sequences and projects potential future price movements using advanced correlation and similarity measures across multiple timeframes.
A multi-purpose trading indicator that compares cryptocurrency performance against DXY, using advanced statistical models to assess relative strength and potential market movements.
A trading indicator that maps gaps from major indices like SPX onto other asset charts, identifying potential support and resistance levels by translating index gap percentages.
A trading tool that identifies the best negatively correlated asset for hedging by analyzing price correlations across different cryptocurrencies and determining precise hedge quantities.
Likes, views, and comments are historical TradingView snapshots. They describe attention, not trading performance.