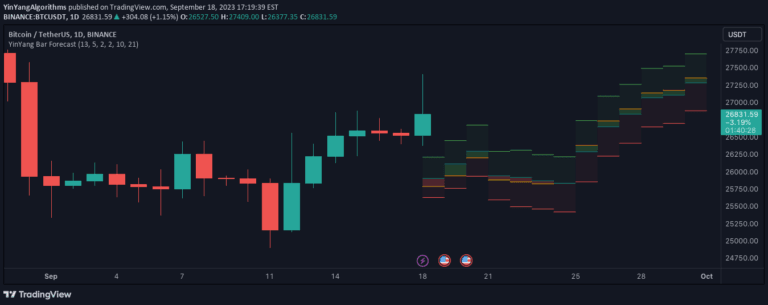
A sophisticated trading indicator that finds historically similar price sequences and projects potential future price movements using advanced correlation and similarity measures across multiple timeframes.
Explore complementary indicator rolesHow it works
The Next Pivot indicator works by analyzing historical price sequences to identify the most similar past patterns to the current market conditions. It employs multiple statistical similarity measures like Spearman correlation, Pearson correlation, cosine similarity, and mean squared error to find the closest matching price sequence.
Once the most similar historical sequence is identified, the indicator projects forward the subsequent price movement based on what happened after that historical pattern. This projection mechanism allows traders to potentially anticipate future price actions by leveraging historical market behavior and pattern recognition techniques.
Why it may be useful
The indicator provides traders with a unique forecasting tool that goes beyond traditional technical analysis by dynamically searching for correlated price sequences. By utilizing multiple correlation methods, it offers a sophisticated approach to understanding potential market movements across different timeframes and financial instruments.
This approach can help traders gain insights into potential future price directions by statistically analyzing historical market patterns. It allows for projections not just on price, but on almost any public indicator, making it a versatile tool for traders seeking advanced predictive analytics.
When to explore it
The Next Pivot indicator is most effective when used on markets with clear historical patterns and sufficient trading data. It works best when traders are looking for potential future price movements based on statistical similarities in past market behavior across various timeframes.
Traders should be cautious and use this indicator as part of a comprehensive trading strategy, understanding that while the projections are statistically derived, they are not guaranteed predictions. It is particularly useful for traders seeking to supplement their analysis with data-driven insights and looking to explore potential market movements across different sessions and indicators.
Keep exploring
What we’ve verified
Access, alerts and repainting behaviour have not been independently verified for this indicator. Check the creator’s current publication and settings.
General descriptions and classifications are recovered research. Verified details above identify the specific checks we have completed. Check the creator’s current publication for later changes.