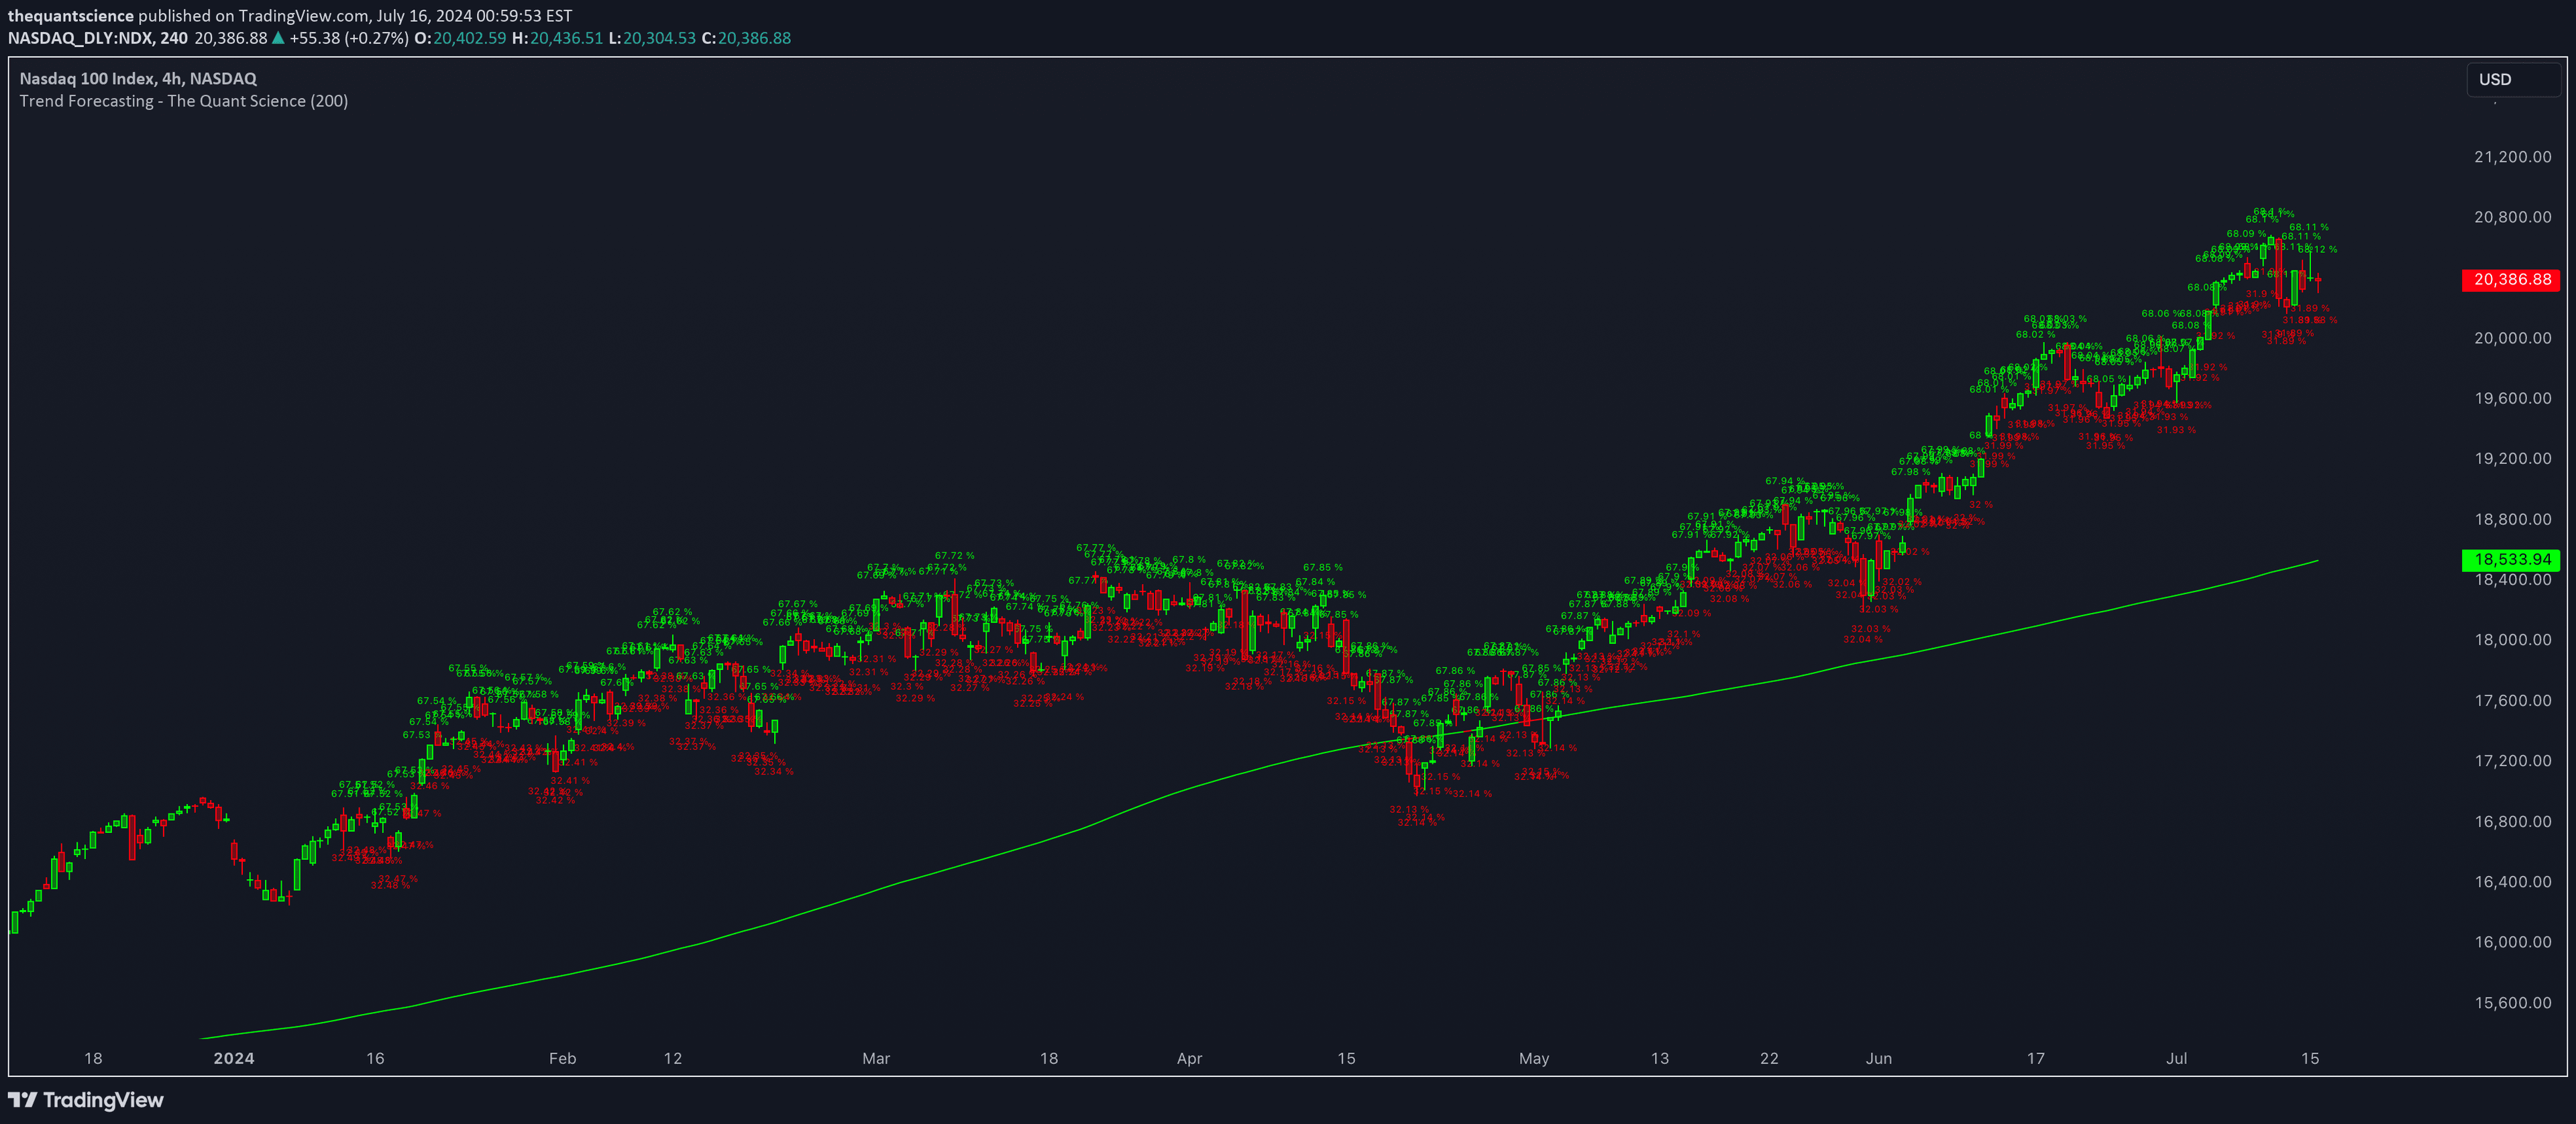
An advanced trading signal that predicts future price movements using autocorrelation and linear regression, providing visual insights for potential market opportunities.
Explore complementary indicator rolesHow it works
The trading signal leverages autocorrelation to analyze historical price relationships and estimate future price movements. It calculates potential gains by examining the correlations between past price patterns and their potential future impact, using a sophisticated mathematical approach that identifies recurring market cycles.
Linear regression is applied to percentage returns, which helps refine the prediction model by understanding the statistical trend of price changes. The model generates visual signals with color-coded labels that indicate potential bullish or bearish forecasts, allowing traders to quickly interpret potential market directions.
Why it may be useful
This trading signal provides traders with a data-driven approach to understanding potential market movements by transforming complex statistical analysis into easy-to-interpret visual cues. By combining autocorrelation and linear regression, the indicator offers a more nuanced view of potential price trajectories beyond traditional technical analysis methods.
The signal's ability to generate color-coded labels and forecast lines enables traders to make more informed decisions quickly. It bridges the gap between complex mathematical models and practical trading insights, helping traders identify potential opportunities with greater confidence and clarity.
When to explore it
The trading signal is most effective in markets with discernible cyclical patterns and consistent price behaviors. It works best for traders seeking to understand short to medium-term price movements, particularly in assets with relatively stable historical price relationships. Traders should use this signal as part of a comprehensive trading strategy, complementing it with other technical and fundamental analysis tools.
The indicator is particularly useful during periods of market stability and when trading assets with predictable momentum. However, traders should remain cautious and not rely solely on this signal, as market conditions can change rapidly and unexpected events can disrupt historical price patterns.
Keep exploring
What we’ve verified
Access, alerts and repainting behaviour have not been independently verified for this indicator. Check the creator’s current publication and settings.
General descriptions and classifications are recovered research. Verified details above identify the specific checks we have completed. Check the creator’s current publication for later changes.