Elliott Wave [LuxAlgo]
Elliott Wave indicator automatically detects impulse and corrective wave patterns in price movements, helping traders identify potential trend directions and market phases.
Explore 11,183 indicators. Filter beyond the obvious.
Discover the tools that fit the way you trade.
11,183 tools to explore
Elliott Wave indicator automatically detects impulse and corrective wave patterns in price movements, helping traders identify potential trend directions and market phases.
A sophisticated trading signal that combines trend detection, price rejection logic, and dynamic ATR-based target projection to identify and validate potential trend continuation opportunities.
A trading script that projects future pivot points by analyzing historical price patterns and calculating potential next pivot locations using statistical analysis of market movements.
A trading signal that finds the most similar historical price sequences and projects future price movements using multiple similarity and correlation measures.
A price projection tool that forecasts future market behavior by analyzing historical price patterns and applying a user-defined growth factor to simulate potential price movements.
A multi-harmonic trigonometric model that extrapolates price trends using Fourier series and Quinn-Fernandes algorithm for predicting future price movements and cycles.
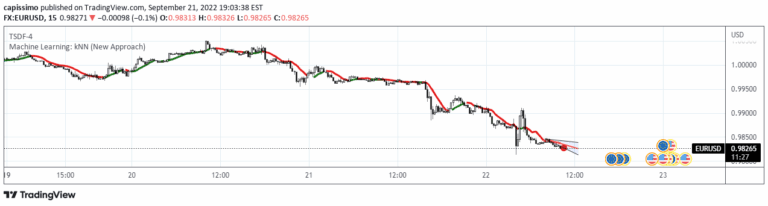
KNN is a machine learning technique predicting next price bar using nearest neighbor data points, providing trend insights by analyzing historical price sequences.
A trading tool that predicts market movements by analyzing historical candlestick colors and patterns, projecting future price action based on similar past events.
A Monte Carlo simulation tool that generates potential future price paths by randomly shuffling historical price changes to predict potential market movements and support/resistance levels.
An advanced trading indicator that analyzes price ranges within specific time sessions by measuring standard deviation extensions and tracking price interactions with projected levels.
ABCD Projection Indicator identifies and projects ABCD chart patterns using a Zigzag-based approach, helping traders spot potential trend continuation opportunities in financial markets.
A technical analysis tool that scans historical price data to identify chart patterns and project potential future price movements based on historical pattern performance.
Likes, views, and comments are historical TradingView snapshots. They describe attention, not trading performance.