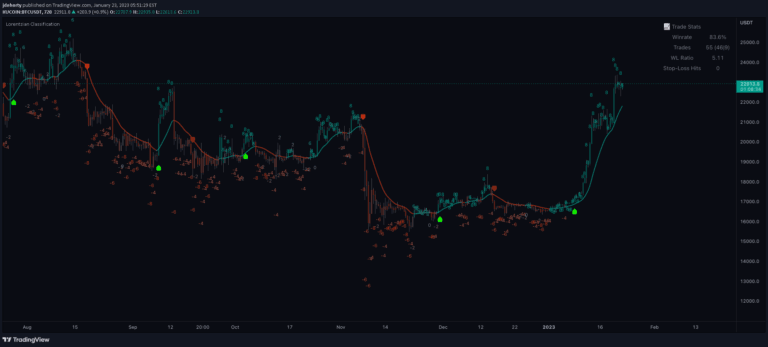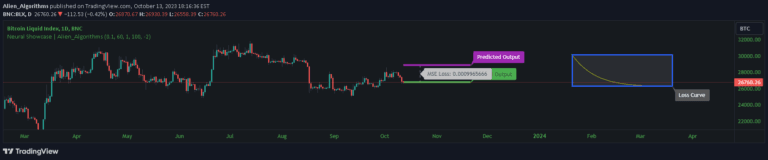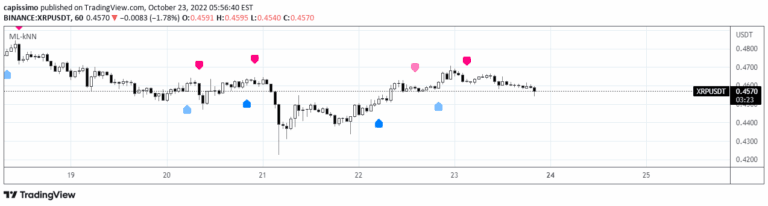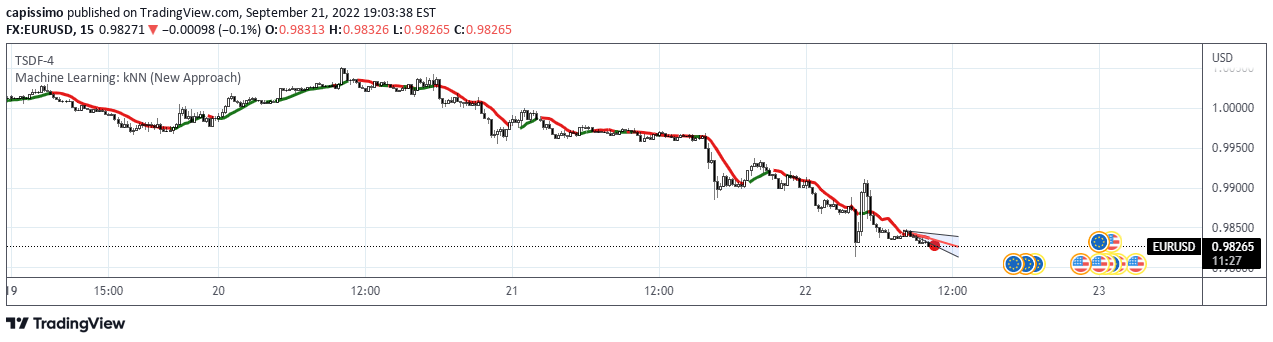
KNN is a machine learning technique predicting next price bar using nearest neighbor data points, providing trend insights by analyzing historical price sequences.
Explore complementary indicator rolesHow it works
KNN algorithm predicts future price by analyzing historical data points through nearest neighbor calculations. It selects K nearest neighbors from training data based on price proximity. The method involves computing absolute distance between current instance and training samples.
After ranking distances, it identifies K closest neighbors. The prediction is then generated by taking the average value of these nearest neighbors, creating a smoothed price projection that approximates moving average behavior
Why it may be useful
KNN provides traders with a data-driven approach to price prediction by leveraging historical price patterns. Its machine learning framework allows adaptive predictions without complex mathematical modeling. The technique helps identify potential price movements by examining similar historical data points.
By understanding neighborhood relationships in price data, traders can make more informed decisions. KNN's simplicity and robustness make it accessible for various trading strategies. It offers insights into potential price trends and directional movements
When to explore it
KNN works best with large, consistent historical price datasets across medium to long-term trading scenarios. It is most effective when price patterns exhibit some repeatable characteristics. Traders should use KNN when seeking trend predictions in relatively stable market conditions.
The method performs well in markets with clear directional movements and sufficient historical data. It is particularly useful for swing trading strategies seeking predictive insights. Optimal performance requires careful selection of neighbor count and robust training dataset
Keep exploring
What we’ve verified
Access, alerts and repainting behaviour have not been independently verified for this indicator. Check the creator’s current publication and settings.
General descriptions and classifications are recovered research. Verified details above identify the specific checks we have completed. Check the creator’s current publication for later changes.