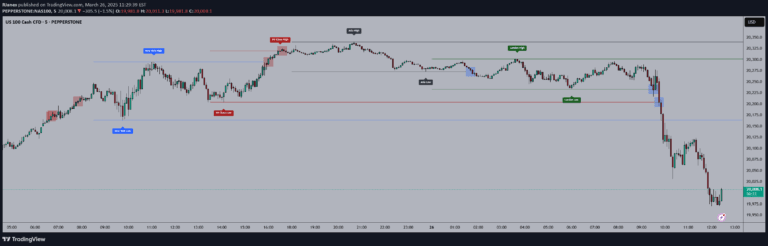
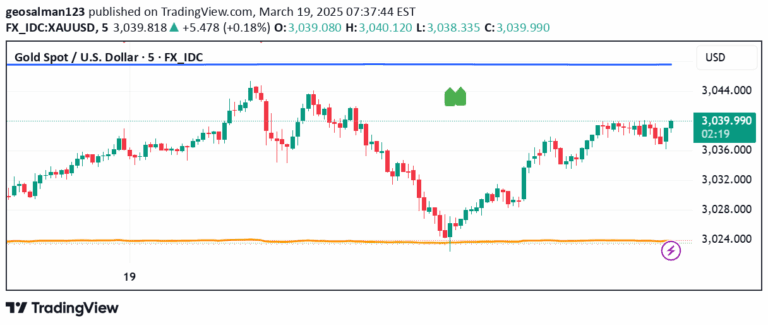
An advanced trading indicator that analyzes price ranges within specific time sessions by measuring standard deviation extensions and tracking price interactions with projected levels.
Explore complementary indicator rolesHow it works
The indicator focuses on analyzing price ranges within a specific time session, such as the New York or Asia trading sessions. It calculates standard deviation extensions from the initial price range, creating multiple projection levels at 1, 2, 2.5, and 4 standard deviations.
By extrapolating these levels, traders can observe how price interacts with these projected zones before the next trading session begins. The indicator also implements a standard deviation filter to eliminate sessions with ranges exceeding a predetermined threshold, ensuring more precise and relevant analysis.
Why it may be useful
This indicator provides traders with a sophisticated method of understanding price behavior within specific market sessions. By tracking how often price reaches certain standard deviation levels, traders can gain insights into potential support, resistance, and market dynamics that might not be immediately visible.
The methodology allows for flexible application across different trading sessions and timeframes, making it a versatile tool for analyzing market movements. It helps traders identify potential turning points, gauge market volatility, and develop more nuanced trading strategies based on statistical price distribution.
When to explore it
The indicator is most effective during periods of consistent trading activity, particularly within well-defined market sessions like the New York or Asia trading windows. Traders can utilize this tool when seeking to understand price range dynamics and potential extension levels beyond the initial session range.
It works best for traders interested in statistical analysis of price movements and those who want to develop a more structured approach to identifying potential trading opportunities. The indicator is particularly useful for traders who focus on short to medium-term trading strategies and want to gain deeper insights into market behavior.
Keep exploring
What we’ve verified
Access, alerts and repainting behaviour have not been independently verified for this indicator. Check the creator’s current publication and settings.
General descriptions and classifications are recovered research. Verified details above identify the specific checks we have completed. Check the creator’s current publication for later changes.