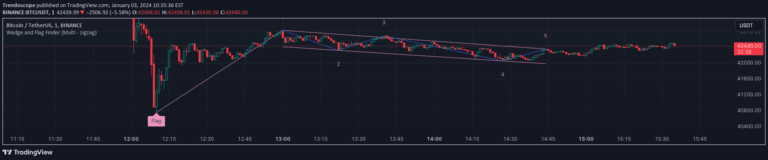
A trading script that projects future pivot points by analyzing historical price patterns and calculating potential next pivot locations using statistical analysis of market movements.
Explore complementary indicator rolesHow it works
The script analyzes pivot points in price movements, tracking historical occurrences of Higher High (HH), Higher Low (HL), Lower High (LH), and Lower Low (LL) patterns. It calculates average ratios and bar lengths for these pivot types to project potential future pivot locations.
By examining the last two pivots, including an unconfirmed pivot, the script generates projections for the next potential pivot point. The method uses statistical probability and historical price behavior to estimate future price movements and pivot locations
Why it may be useful
This indicator provides traders with a predictive tool for understanding potential future price movements based on historical patterns. By quantifying and visualizing pivot point probabilities, traders can gain insights into potential trend continuations or reversals.
The script offers a data-driven approach to anticipating market behavior, helping traders make more informed decisions about entry and exit points. The historical projection cloud adds an additional layer of visual context for understanding potential price ranges
When to explore it
The pivot projection script works best in markets with clear trending behavior and relatively consistent price patterns. It is most effective in timeframes that allow sufficient historical data for statistical analysis, such as swing trading and longer-term investment strategies.
Traders should use this tool in conjunction with other technical analysis methods and risk management strategies. It is particularly useful for markets with predictable cyclic movements and for traders looking to understand potential future price trajectories
Keep exploring
What we’ve verified
Access, alerts and repainting behaviour have not been independently verified for this indicator. Check the creator’s current publication and settings.
General descriptions and classifications are recovered research. Verified details above identify the specific checks we have completed. Check the creator’s current publication for later changes.