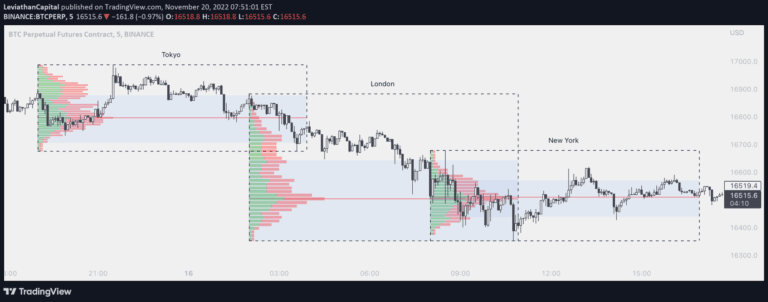
A comprehensive market session indicator that displays TPO profiles, market session times, volume delta, and price forecasts across different trading periods with advanced statistical analysis.
Explore complementary indicator rolesHow it works
The indicator generates a detailed market session analysis by tracking multiple trading sessions with visual representations. It creates TPO (Time Price Opportunity) profiles using traditional lettering systems or bar displays. The tool calculates and displays key session metrics including volume delta, open interest change, total volume, and price range.
It also projects a forecast for the remaining session duration, which can be enhanced using Average True Range (ATR). The indicator maintains naked Point of Control (POC) levels until they are violated, providing traders with dynamic market insights
Why it may be useful
This indicator provides traders with a comprehensive market overview by consolidating multiple critical trading metrics into a single visual display. It helps traders understand session dynamics, volume trends, and potential price movements.
By displaying TPO profiles and session forecasts, traders can make more informed decisions about market sentiment and potential price trajectories. The tool's ability to track volume delta, open interest, and session ranges offers deeper market insights beyond basic price action
When to explore it
The indicator is most effective during active trading sessions with significant market activity. It works best for traders seeking detailed market analysis across different timeframes, particularly in liquid markets like futures, forex, and major stock indices.
Traders can utilize this tool during key market hours to understand session dynamics, volume trends, and potential price movements. It is particularly useful for day traders and swing traders who require comprehensive market information to make strategic trading decisions
Keep exploring
What we’ve verified
Access, alerts and repainting behaviour have not been independently verified for this indicator. Check the creator’s current publication and settings.
General descriptions and classifications are recovered research. Verified details above identify the specific checks we have completed. Check the creator’s current publication for later changes.