Volume / Open Interest "Footprint" - By Leviathan
A footprint bar indicator that visualizes volume or open interest data within the chart's visible range, offering three different heatmap styles to analyze trading activity.
Explore 11,183 indicators. Filter beyond the obvious.
Discover the tools that fit the way you trade.
11,183 tools to explore
A footprint bar indicator that visualizes volume or open interest data within the chart's visible range, offering three different heatmap styles to analyze trading activity.
Volume Delta Candles analyze intrabar trading activity by comparing buy and sell volumes, providing visual insights into price movement and trading sentiment within each candle.
A dynamic trend-following indicator that uses Variable Index Dynamic Average to adapt to market volatility, providing insights into price movements and volume pressure.
A trading indicator that calculates volume delta and open interest delta, providing insights into market sentiment and trading activity across different price levels and asset types.
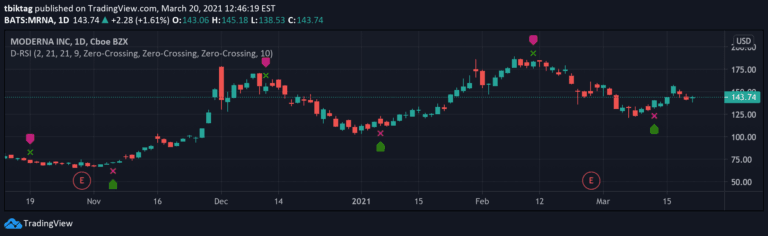
Delta-RSI Oscillator is a momentum indicator that measures the rate of change in RSI through a smoothed time derivative, providing dynamic insights into market momentum shifts.
Volume Suite provides multiple volume-based indicators to analyze trading activity, including Volume Delta, CVD, Buy/Sell Volume, and Relative Volume for comprehensive market insights.
A comprehensive trading indicator combining Parabolic SAR, EMA 200, and MACD to generate precise buy and sell signals by analyzing market trends and momentum.
An advanced Open Interest indicator that provides comprehensive market insights through multiple visualization techniques and real-time statistical analysis of trading positions.
A charting tool that tracks money flow and trading pressure across different price ranges, revealing market sentiment and significant price levels through buying and selling activity visualization.
An advanced trading tool that analyzes price ranges by automatically drawing range levels, volume profiles, and various analytical tools to help traders understand market structure and potential price movements.
A real-time trading profile indicator that visualizes volume, price, time, activity, and age across different market levels, providing dynamic insights into trading activity.
A volume delta indicator that analyzes intrabar volume to estimate buying and selling pressure by calculating five distinct volume balances and divergence channels.
Likes, views, and comments are historical TradingView snapshots. They describe attention, not trading performance.