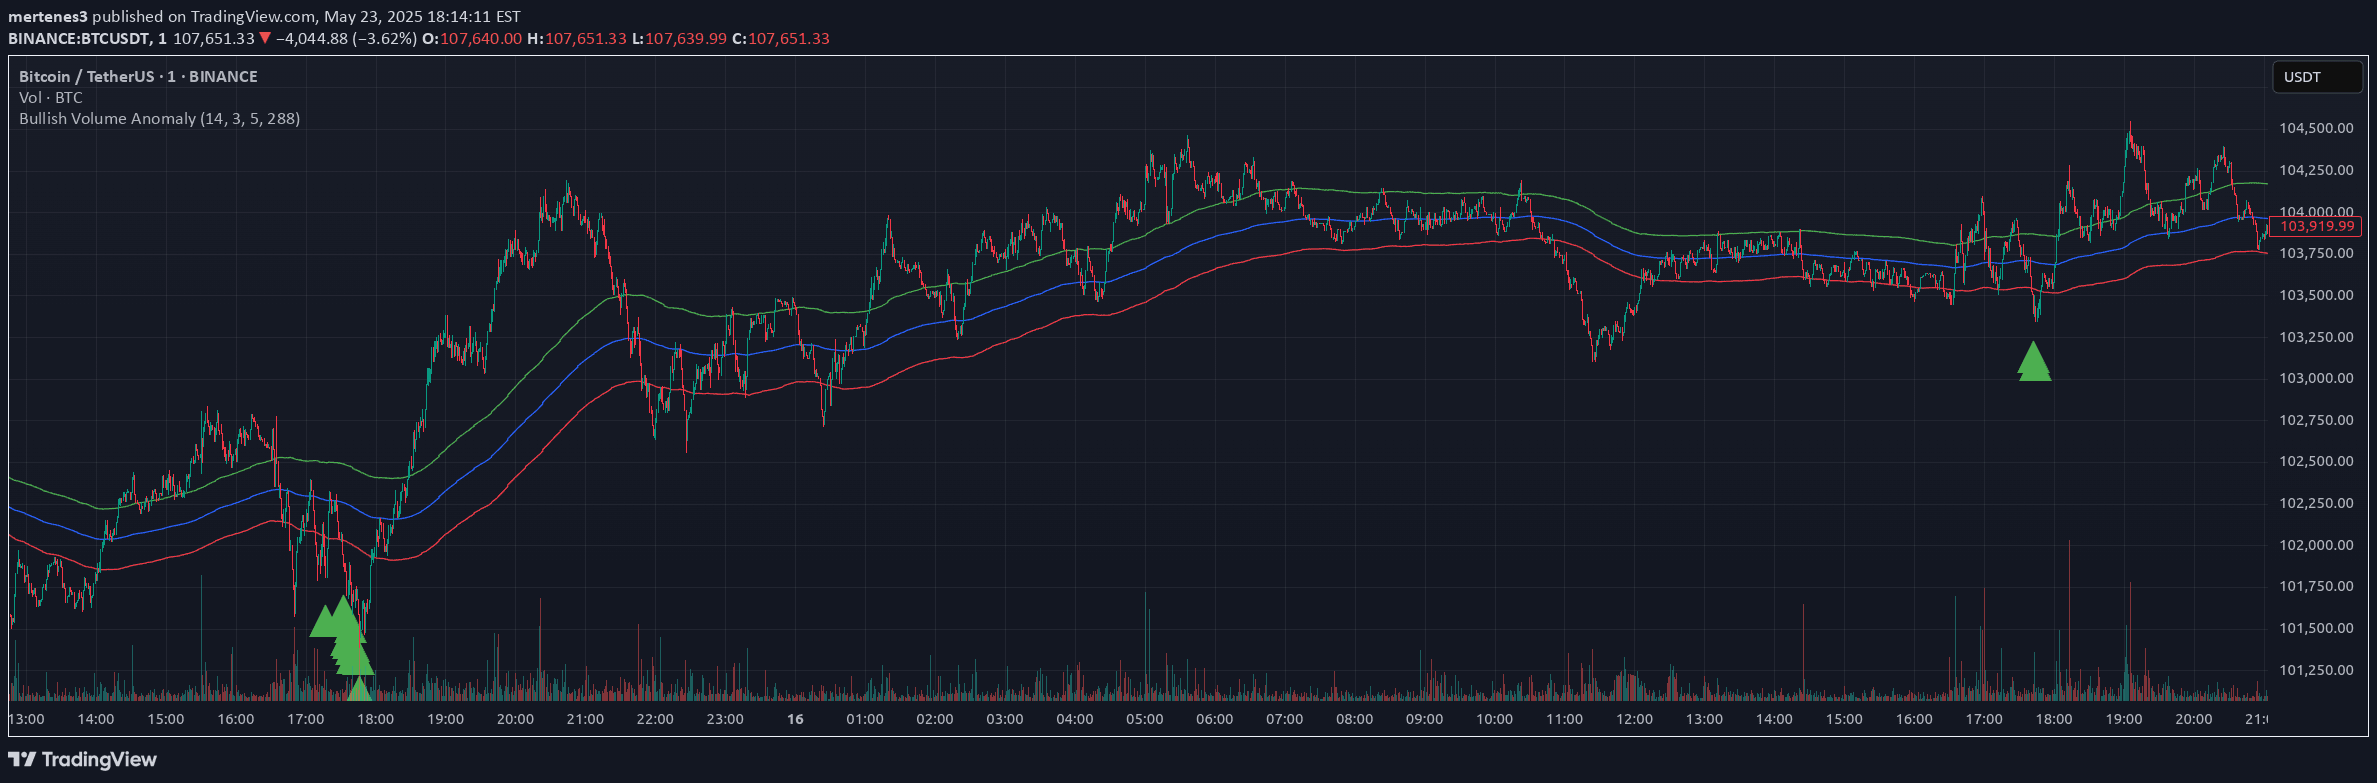
A trading indicator that calculates cumulative volume delta across price trends, providing insights into trend strength and potential price movement reversals using a customizable zig-zag approach.
Explore complementary indicator rolesHow it works
The Trended CVD indicator first identifies price trends using a zig-zag algorithm, which allows for flexible trend detection based on user-defined parameters. It then calculates the cumulative volume delta (CVD) specifically for each identified trend segment, tracking the net buying or selling pressure throughout the price movement.
By normalizing the CVD to scale with the chart, the indicator plots the volume delta alongside the price trend, creating a visual representation of volume dynamics. The system distinguishes between different trend scenarios, such as uptrends with corresponding CVD movement and potential divergences where CVD moves contrary to price action.
Why it may be useful
The Trended CVD provides traders with a nuanced understanding of market dynamics by revealing the underlying volume dynamics during price trends. By correlating price movement with cumulative volume delta, traders can gain insights into the strength and potential sustainability of a trend, helping to confirm or challenge existing price movements.
This indicator offers a sophisticated approach to volume analysis, allowing traders to detect subtle market signals that might not be apparent through price action alone. The ability to identify CVD divergences can provide early warnings about potential trend reversals or weakening momentum, enabling more informed trading decisions.
When to explore it
The Trended CVD is most effective in markets with clear trending behavior, such as stocks, futures, and forex, where volume plays a significant role in price movement. It works particularly well during periods of sustained directional price action, helping traders confirm trend strength and identify potential reversal points.
Traders should consider using this indicator in conjunction with other technical analysis tools to validate signals and reduce false positives. It is especially useful during volatile market conditions, when understanding volume dynamics can provide critical insights into market sentiment and potential price trajectory.
Keep exploring
What we’ve verified
Access, alerts and repainting behaviour have not been independently verified for this indicator. Check the creator’s current publication and settings.
General descriptions and classifications are recovered research. Verified details above identify the specific checks we have completed. Check the creator’s current publication for later changes.