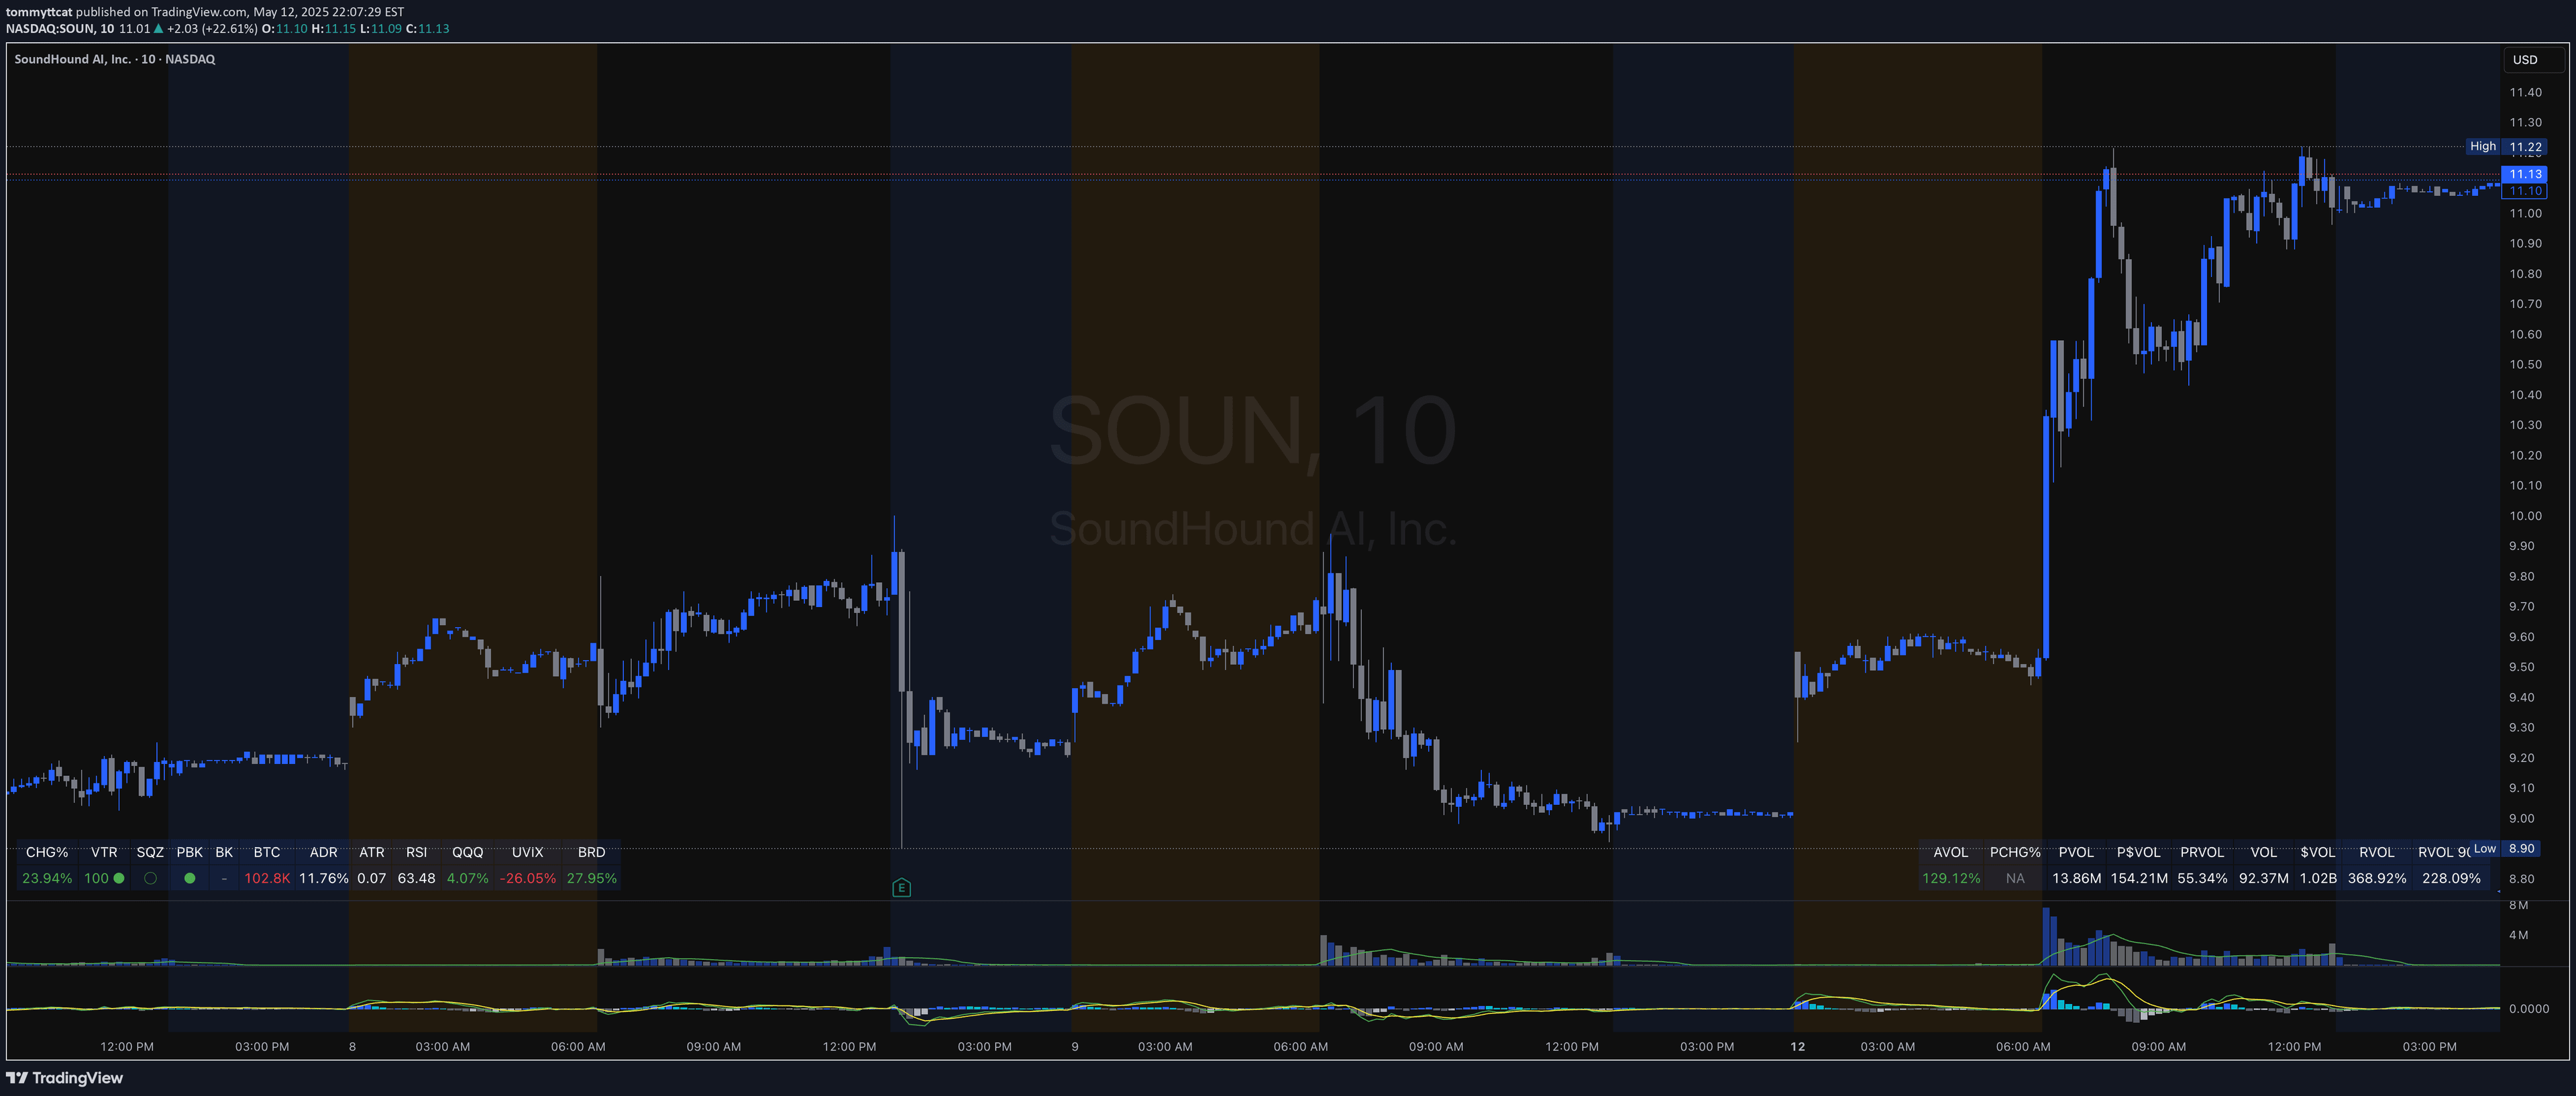
A volume-based indicator that tracks buying and selling pressure by analyzing daily price changes and volume, helping traders identify potential market trends and momentum shifts.
Explore complementary indicator rolesHow it works
The Volume Direction Indicator segregates trading volume into buying and selling categories based on price action within each trading bar. When prices close higher, the volume is considered 'bought', plotted as a green line, while price declines are represented by a red line indicating 'sold' volume.
This indicator resets daily, providing a fresh perspective on trading activity by tracking cumulative volume dynamics. It simplifies market analysis by directly linking volume to price movements, offering traders a visual representation of market sentiment and potential directional shifts.
Why it may be useful
By distinguishing between buying and selling volume, traders can gain insights into market psychology and potential trend reversals. The indicator helps identify periods of strong buying or selling pressure, which can signal emerging market momentum and trader sentiment.
The daily reset feature ensures traders focus on current market conditions without being influenced by historical volume accumulations. This approach provides a dynamic, real-time view of market activity, helping traders make more informed decisions about potential entry and exit points.
When to explore it
The Volume Direction Indicator is most effective in markets with clear price movements and significant volume. It works best during trending markets where price and volume show consistent patterns, helping traders confirm potential trend strengths and weaknesses.
Traders should use this indicator in conjunction with other technical analysis tools to validate signals and reduce false interpretations. It is particularly useful for short-term trading strategies, such as scalping and day trading, where quick identification of market sentiment can provide a competitive edge.
Keep exploring
What we’ve verified
Access, alerts and repainting behaviour have not been independently verified for this indicator. Check the creator’s current publication and settings.
General descriptions and classifications are recovered research. Verified details above identify the specific checks we have completed. Check the creator’s current publication for later changes.