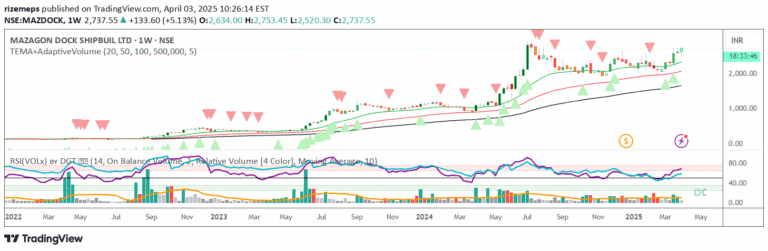
Advanced volume analysis indicator tracking institutional trading activity through multiple volume patterns, detecting potential accumulation, distribution, and market trend shifts.
Explore complementary indicator rolesHow it works
The Institutional Volume Footprint Pro analyzes trading volume using multiple sophisticated detection techniques, including Pocket Pivot Volume and Pivot Negative Volume methodologies. It identifies institutional trading activity by examining volume patterns across different timeframes, tracking how volume relates to price movement and detecting potential market sentiment shifts.
The indicator generates visual signals through color-coded volume bars and labels, highlighting specific volume patterns like accumulation, distribution, volume dry-up, and volume climax. By comparing current volume against historical averages and applying custom lookback periods, the tool provides real-time analytics that help traders understand underlying market dynamics.
Why it may be useful
Volume analysis provides crucial insights into market strength, revealing whether price movements are supported by significant trading activity or potentially misleading. By tracking institutional trading patterns, traders can gain a deeper understanding of smart money movements and potential market trend reversals before they become obvious to the broader market.
This indicator helps traders make more informed decisions by offering a comprehensive view of volume dynamics, distinguishing between genuine trend confirmations and potential false breakouts. The multi-dimensional approach allows traders to detect subtle market shifts and align their strategies with the most likely market movements.
When to explore it
The Institutional Volume Footprint Pro is most effective during periods of market transition, such as potential trend reversals, breakouts, and consolidation phases. Traders should pay special attention to signals during key market sessions, particularly when volume patterns diverge from typical price action or show unusual institutional activity.
The indicator works best when combined with other technical analysis tools, used across multiple timeframes to confirm signals and provide a comprehensive market assessment. Traders should be particularly attentive to signals during earnings announcements, economic news releases, and periods of increased market volatility.
Keep exploring
What we’ve verified
Access, alerts and repainting behaviour have not been independently verified for this indicator. Check the creator’s current publication and settings.
General descriptions and classifications are recovered research. Verified details above identify the specific checks we have completed. Check the creator’s current publication for later changes.