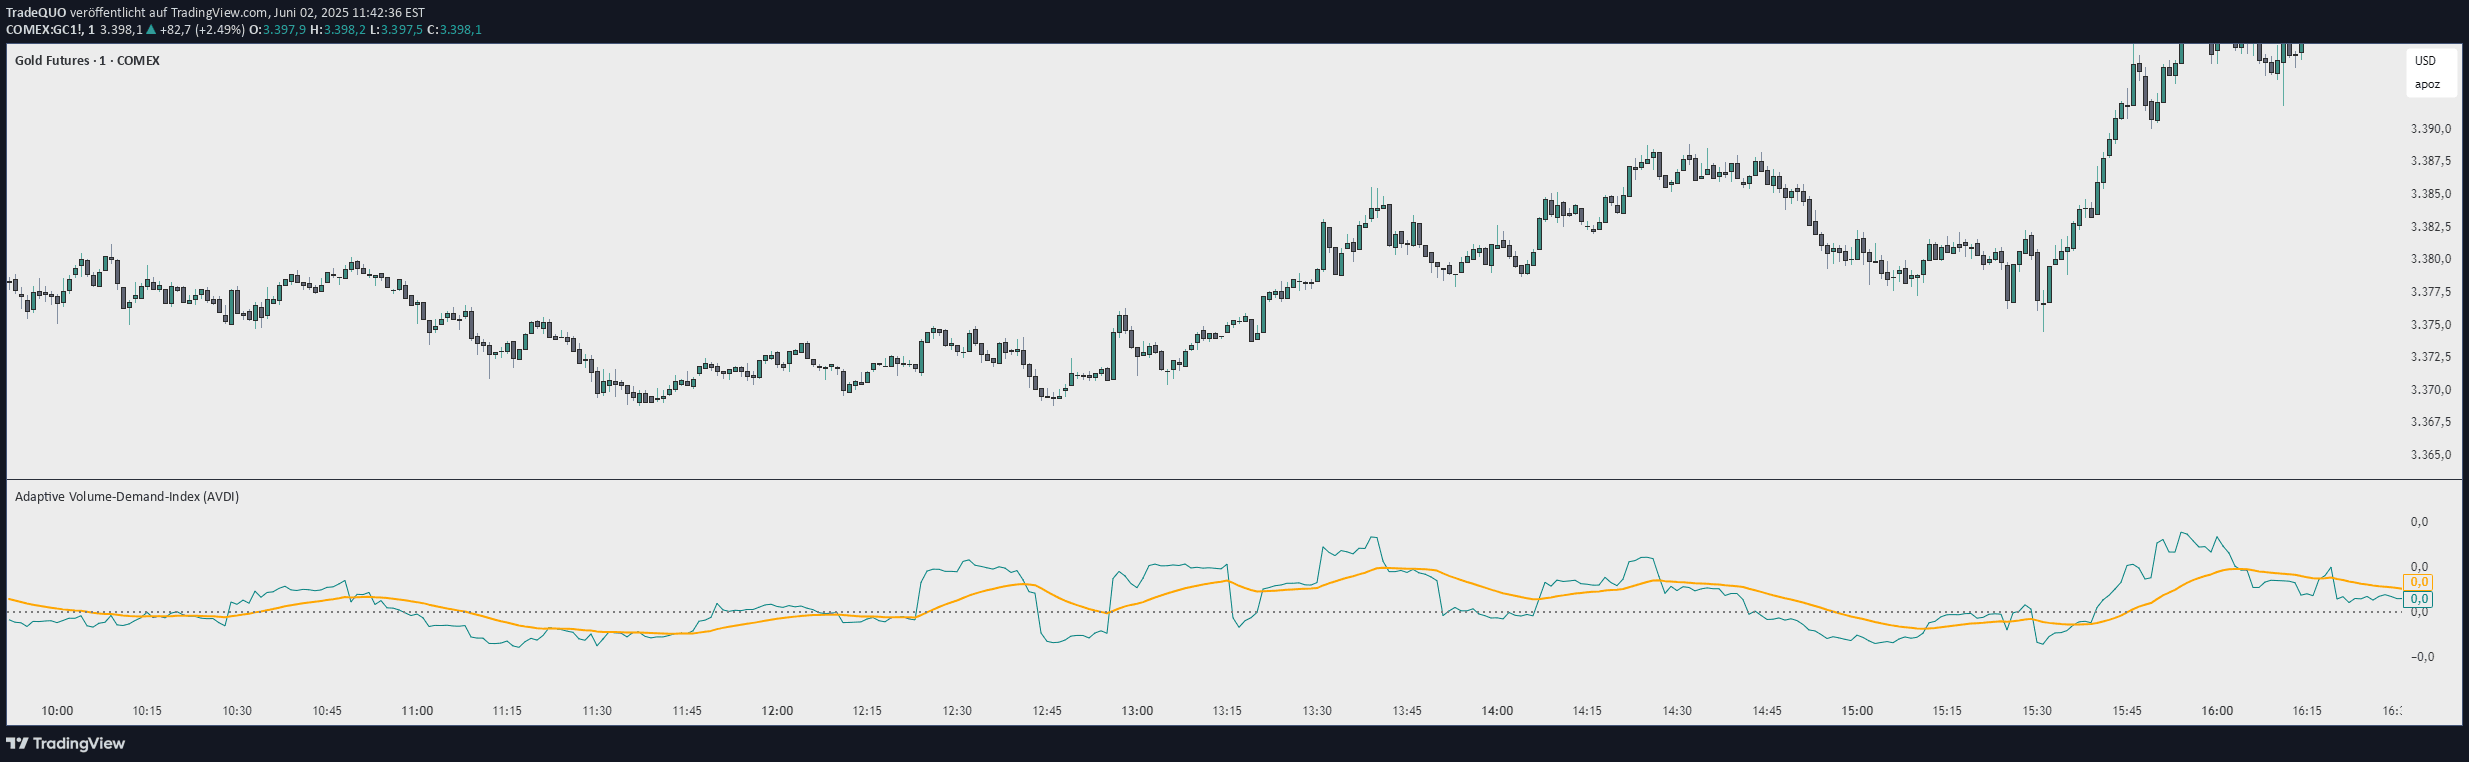
A crypto trading indicator that identifies potential whale market activity by analyzing volume and price spikes to generate buy and sell signals during significant market movements.
Explore complementary indicator rolesHow it works
The Whale Activity Impact Oscillator analyzes market volume and price changes over a configurable lookback period to detect abnormal trading activity. It calculates average volume and percentage price changes, then compares current market conditions against these baseline metrics.
When current volume exceeds the average by a specified multiplier and price moves significantly, the indicator generates signals. Buy signals occur during volume and price increases, while sell signals happen when volume spikes accompany price decreases, helping traders identify potential large-scale market interventions.
Why it may be useful
Detecting whale activity provides crucial insights into potential market movements that individual traders might otherwise miss. By highlighting significant volume and price changes, the indicator helps traders understand when large market participants are making substantial trades that could influence asset prices.
The oscillator's ability to filter out low-liquidity environments and provide clear visual signals makes it a valuable tool for crypto traders seeking to make more informed decisions. It transforms complex market data into an easily interpretable histogram that quickly communicates market sentiment and potential trading opportunities.
When to explore it
The Whale Activity Impact Oscillator is most effective in volatile cryptocurrency markets with significant trading volumes. It works best when monitoring assets with active institutional or large-scale trader participation, where whale movements can dramatically impact price dynamics.
Traders should utilize this indicator during periods of high market activity, particularly when seeking to identify potential trend reversals or momentum shifts. It is especially useful for short-term trading strategies that require quick, data-driven decision-making based on significant market movements.
Keep exploring
What we’ve verified
Access, alerts and repainting behaviour have not been independently verified for this indicator. Check the creator’s current publication and settings.
General descriptions and classifications are recovered research. Verified details above identify the specific checks we have completed. Check the creator’s current publication for later changes.