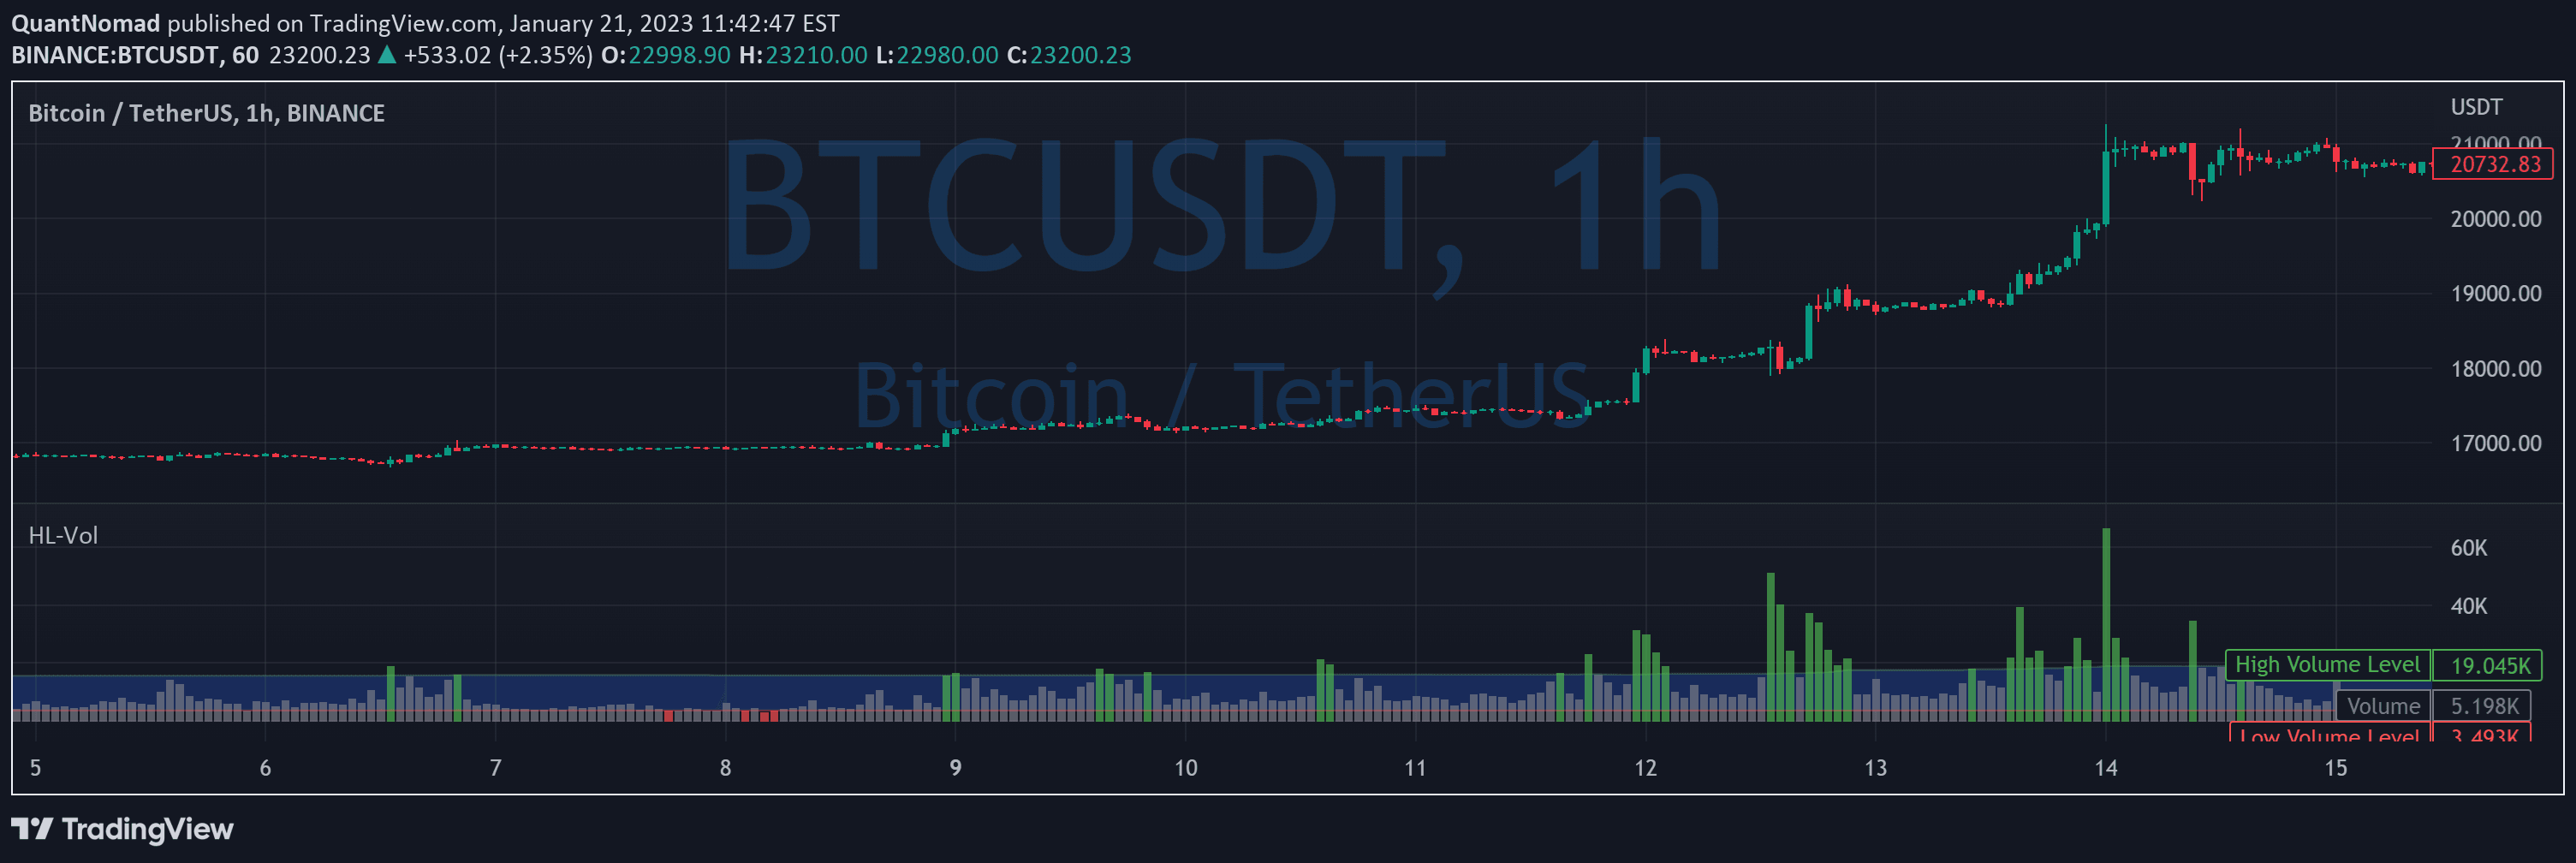
A volume analysis indicator that identifies significant trading volume spikes and highlights market activity through color-coded visual alerts to help traders recognize potential trading opportunities.
Explore complementary indicator rolesHow it works
The FuTech V-Spike & V-Highlighter calculates volume spikes by comparing current trading volume against a user-defined exponential moving average (EMA) threshold. Traders can customize the multiplier, typically set at 1.5, which means the volume must exceed 1.5 times the average volume over a specified lookback period.
The indicator uses color coding to visually represent volume dynamics, with green candles showing yellow bars for bullish sentiments and red candles displaying black bars for bearish sentiments. It allows flexible configuration of lookback periods and provides instant visual cues about significant volume changes in the market.
Why it may be useful
Volume indicators are crucial for traders because they provide insights beyond price movement, revealing the strength and potential sustainability of market trends. By analyzing trading volume, traders can confirm price movements, identify potential trend reversals, and gauge market sentiment more accurately.
The V-Spike & V-Highlighter helps traders make more informed decisions by transforming complex volume data into easily interpretable visual signals. It bridges the gap between raw trading volume and actionable trading insights, enabling traders to detect significant market activities that might otherwise go unnoticed.
When to explore it
This volume indicator is most effective during periods of market volatility, such as around major economic announcements, earnings releases, or significant news events that can trigger substantial trading volume changes. Traders can use it across various financial instruments and timeframes to identify potential entry and exit points.
The indicator works best when combined with other technical analysis tools, helping traders confirm signals from price action, trend indicators, or momentum oscillators. It is particularly useful for traders seeking to validate trend strength, detect potential breakouts, and understand underlying market dynamics beyond simple price movements.
Keep exploring
What we’ve verified
Access, alerts and repainting behaviour have not been independently verified for this indicator. Check the creator’s current publication and settings.
General descriptions and classifications are recovered research. Verified details above identify the specific checks we have completed. Check the creator’s current publication for later changes.