Volume Profile / Fixed Range
A Volume Profile indicator that calculates trading volumes within a fixed range, helping traders understand volume distribution and identifying key price levels with visual representation.
Explore 11,183 indicators. Filter beyond the obvious.
Discover the tools that fit the way you trade.
11,183 tools to explore
A Volume Profile indicator that calculates trading volumes within a fixed range, helping traders understand volume distribution and identifying key price levels with visual representation.
An advanced trading strategy measuring the opening range of a trading session to identify potential breakout opportunities and determine market trend direction with precise entry and exit points.
Volume Delta Candles analyze intrabar trading activity by comparing buy and sell volumes, providing visual insights into price movement and trading sentiment within each candle.
Day Trading Booster is a comprehensive trading tool designed to help traders identify optimal market entry and exit points by analyzing trading sessions, market volumes, and key price levels.
Tick Chart is a unique charting method that creates candlesticks based on a specific number of price ticks, offering an alternative to time-based charts for analyzing market movements.
A volume profile charting tool that visualizes trading volume distribution across price levels, detecting significant volume nodes and clusters for strategic trading insights.
A volume heat map indicator that colors volume bars and candles based on the standard deviation of trading volume from its average. Provides visual insights into volume intensity and potential market significance.
A trading indicator that calculates volume delta and open interest delta, providing insights into market sentiment and trading activity across different price levels and asset types.
Global Monetary Supply M2 tracks the monetary volume of the world's richest and most populous countries, measuring currency liquidity in USD.
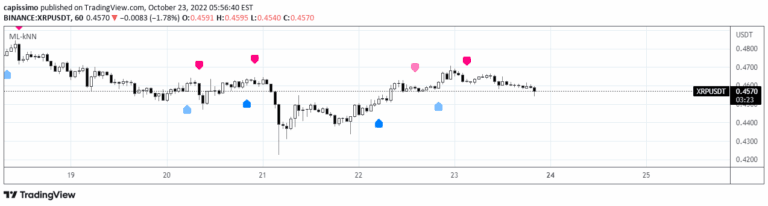
A k-Nearest Neighbours machine learning strategy that predicts market moves by analyzing historic data and finding similar past market conditions to forecast future price directions.
Volume Suite provides multiple volume-based indicators to analyze trading activity, including Volume Delta, CVD, Buy/Sell Volume, and Relative Volume for comprehensive market insights.
A trading signal that tracks volume swings by identifying increasing volume and higher highs/lower lows across multiple bars, revealing potential support and resistance levels.
Likes, views, and comments are historical TradingView snapshots. They describe attention, not trading performance.